
This article highlights best Angular chart libraries.
Imagine if you could make Angular development faster, and see an instant boost in your workflow.
or even better:
What if there were the 10 best Angular chart libraries to choose from.
…and each of them could make your project development faster and easier?
You’d probably be pumped to read about them.
Lucky for you, that’s exactly what I’m going to share with you in this post:
10 best Angular chart libraries
Listed Angular chart libraries include dynamic graphs base-charts, interactive charts, and all the main chart types which can ease your Angular development & make your Angular 2+ app more beautiful & interactive.
Let’s get started with the list:
1. ngx-charts
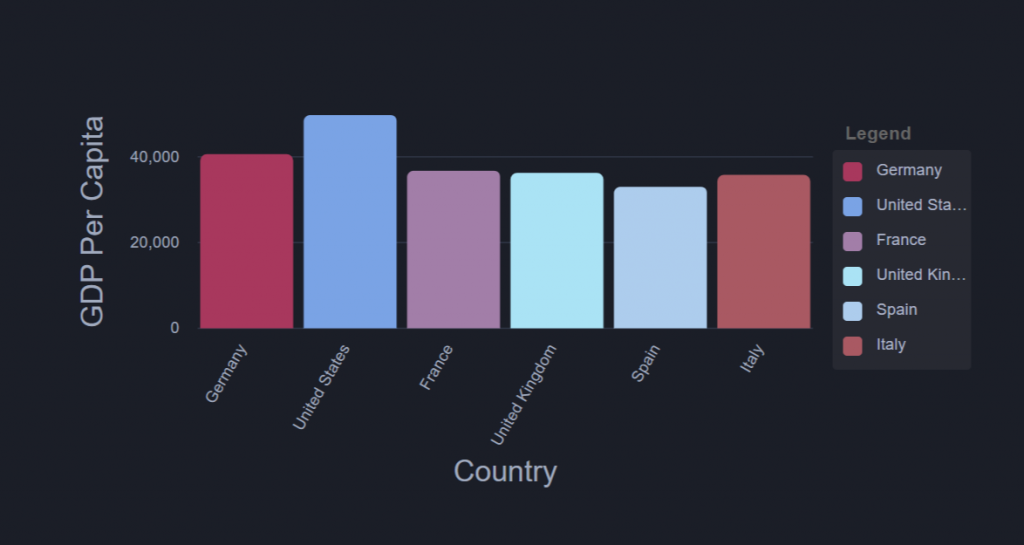
Ngx-charts is declarative Charting Framework for Angular2 and beyond. It uses Angular to render and animate the SVG elements with all of its bindings properties.
Popularity & stats
[gitrepo author=”swimlane” repo=”ngx-charts”]2. Angular nvD3
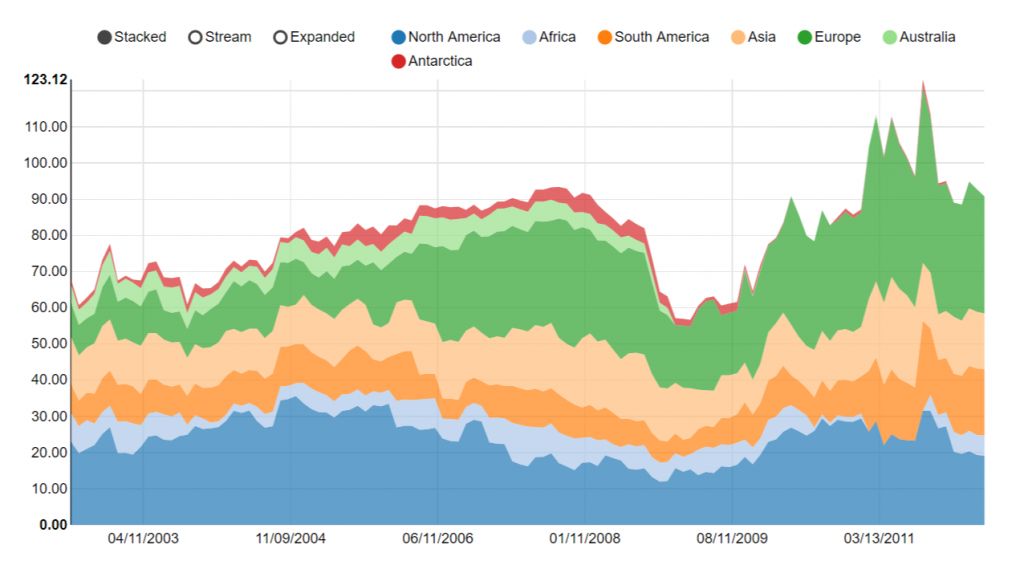
nvD3 is designed to make it easier to work with nvd3.js re-usable charting library. This directive allows you to easily customize your charts via JSON API. the key feature of NvD3 chart library is the original hierarchical structure of nvd3 models is completely preserved in directive JSON structure.
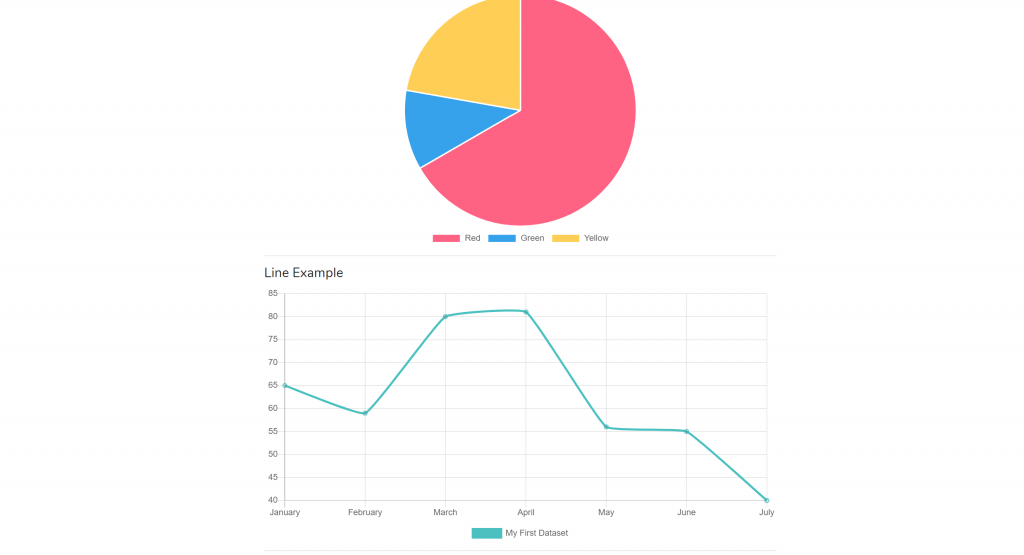
[gitrepo author=”krispo” repo=”angular-nvd3″]3. ng2-charts

ng2-charts is an Angular charting library based on chart.js to create beautiful charts, it includes 6 types of charts: , line, bar, radar, pie, polarArea, doughnut.
4. Highcharts
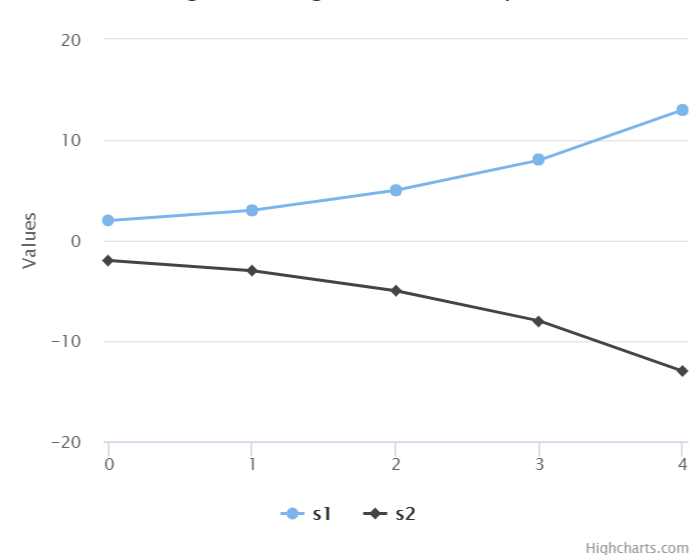
Highchart is yet another Angular charting library based on higlight.js. angular-highcharts is just a thin wrapper of the highchart library and doesn’t bind to initial options.
5. Fusion Charts
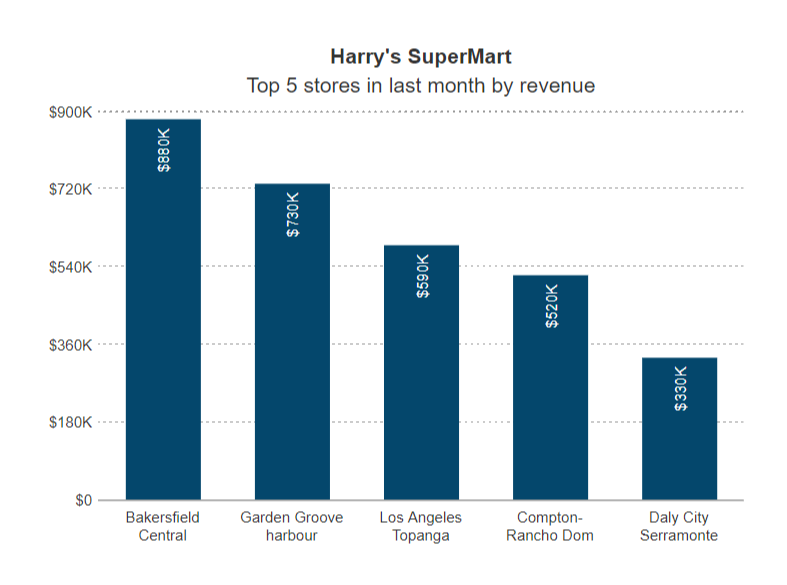
Fusion Chart library is a simple and lightweight Angular component that provides bindings for FusionCharts JavaScript Charting Library. It easily adds rich and interactive charts to any Angular Projects.
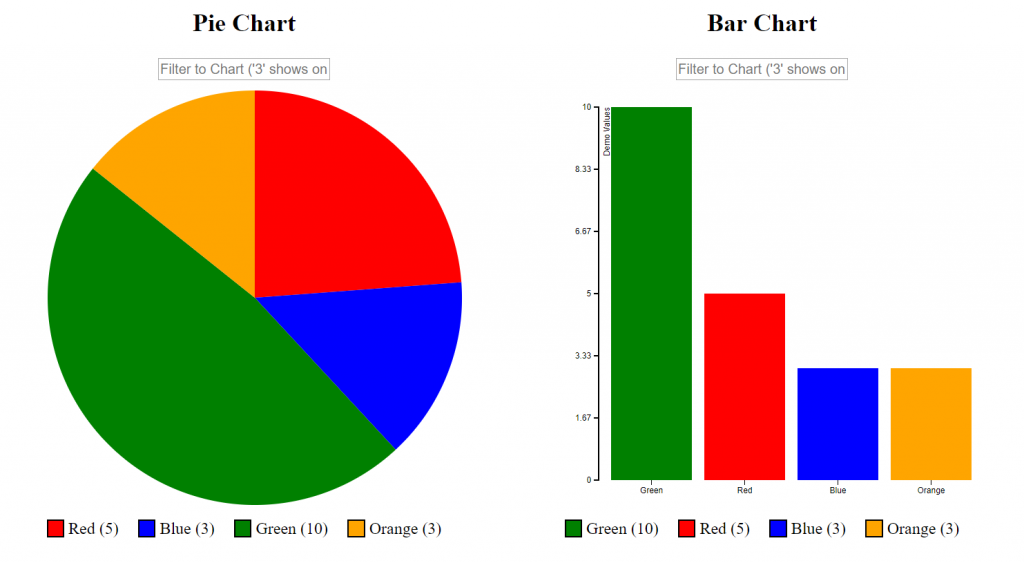
[gitrepo author=”fusioncharts” repo=”angular4-fusioncharts”]6. DlChart
A Lightweight Angular Chart Library. The goal of this Library is to have an easy to use and small in size Chart Library.
It perfect for the usage in a Dashboard or somewhere where you can’t / won’t lazy load a Chart Library.

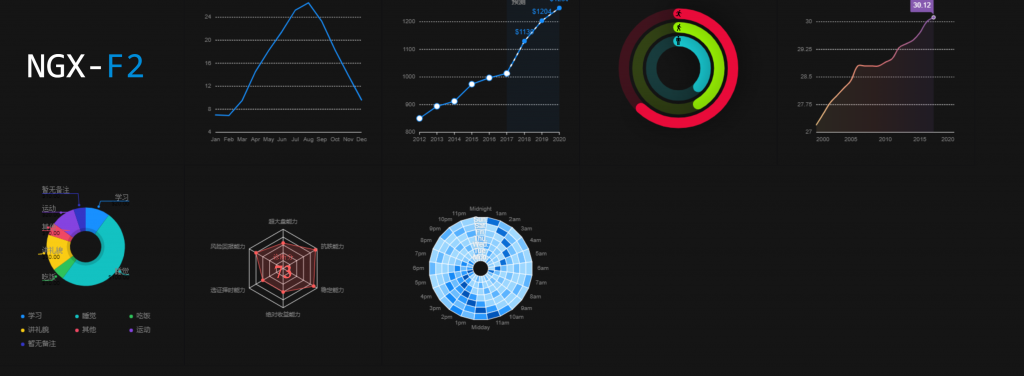
7. ngx-f2
Angular2+ wrapper for antv f2 mobile-oriented charts. perfect for displaying data in mobile devices in a beautiful and interactive way.
8. ng2-google-charts
Google Charts module for Angular 2 and beyond. it includes includes dynamic graphs base-charts, interactive charts, and all the main chart types
9. ng-dygraphs
Angular 2+ and 4+ library for support of dygraphs, It allows users to explore and interpret dense data sets. you can mouse over to highlight individual values. You can click and drag to zoom.
Double-clicking will zoom you back out. Shift-drag will pan.
You can change the number and hit enter to adjust the averaging period.

10. ngx-chartjs
Functional Chart.js wrapper for Angular, Supports all the main chart types which can ease your Angular development
Conclusion
A large amount of data is generated by different web technologies daily which need to be properly refined and visualized to gain proper insights using data visualization. As an Angular developer, it is a great skill set to be able to visualize data as much as you can to make web pages more beautiful & interactive.