
In this article, you will learn about the best JavaScript chart plugins and libraries.
Are you looking for superior methods that are interactive and allow multiple perspectives when visualizing your data?
JavaScript chart Libraries are the most robust data visualization tools to create interactive, easy-to-understand, and beautiful Charts.
That being said let’s highlight top 20 JavaScript Chart plugins and Libraries.
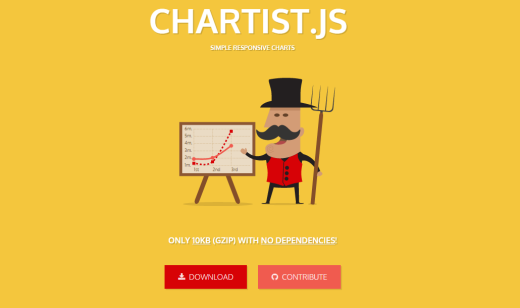
1. Chartist.js
Chartist is intuitive and easy to use for everyone, including those who do not like shifting from excel sheets. The charts are DPI self-reliant and responsive. This makes them suitable for use with any device: a Desktop, tablet, or mobile device. The fact that it is built on SVG makes it highly compatible. Chartist is open source.
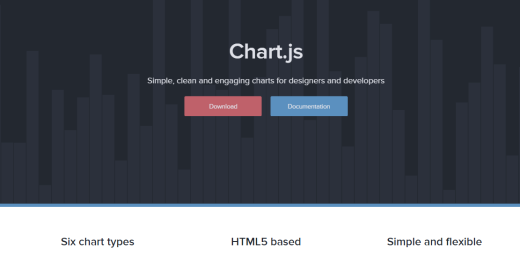
2. Chart.js
Chart.js is an open-source chart suitable for small projects. This library is 11kb when zipped and minified. It has six key chart types (radar, line, polar, bar, doughnut, and pie), and each has its own section; therefore, you can stack only the chart types that suit your project.
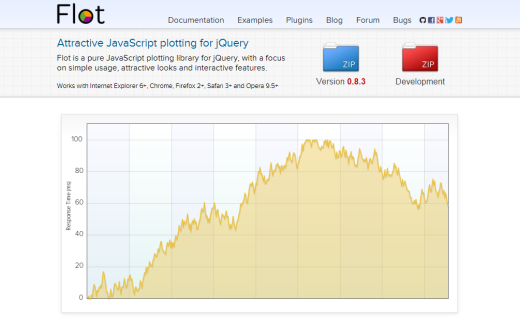
3. Flot
Flot can be classified as one of the earliest charting libraries that focused on simplicity in usage and interactive characteristics. It is particular with jQuery, and you need some basic knowledge of jQuery. The merit is that you are in control of animation, user interaction, and presentation. Flot conforms with many modern browsers, and Its plugin repository has many plot types.
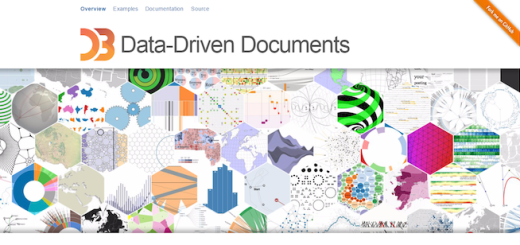
4. D3.js
D3.js is a powerful free chart that helps you fabricate staggering graphics and visual effects. It dynamically reequips the DOM. This makes data alive by use of CSS, SVG, and HTML. It is highly adaptable with many browsers and W3C standards. It is much liked by developers due to its features like Exit and Enter.
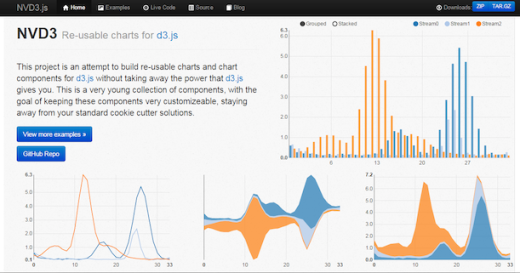
5. NVD3
NVD3 is suitable for constructing recyclable components and charts for D3.js. It is easier to use as compared to d3.js but has similar powerful features. It allows you to build advanced visualizations and deal with composite data sets.
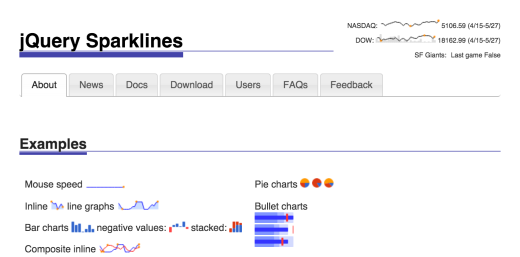
6. jQuery Sparklines
JQuery Sparklines is an open-source bootstrap plugin that is suitable for simple tasks. It generates sparklines which are tiny inline charts that are adequate to give the trends objective using the slightest code.It conforms with nearly all present-day browsers and also outdated browsers like IE6.
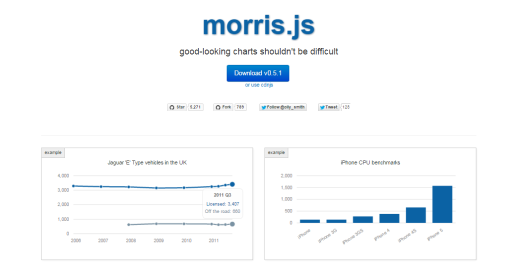
7. Morris.js
Morris.js is an open-source and lightweight Library established on Raphael and jQuery. It offers a clean line, donut, area, and bar charts. It is a great chart if you are searching for an easy, classy, and quick chart.
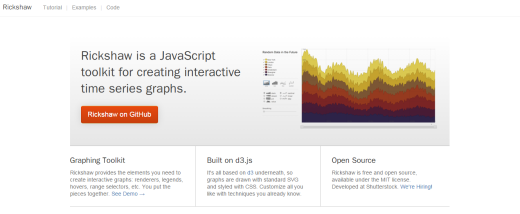
8. Rickshaw
Rickshaw is an open-source chart that was created as a toolkit for developing time chain graphs. It is established in the D3 library. It has a lot of extensions, and its features are customizable to user needs to come up with splendid time-chain charts.
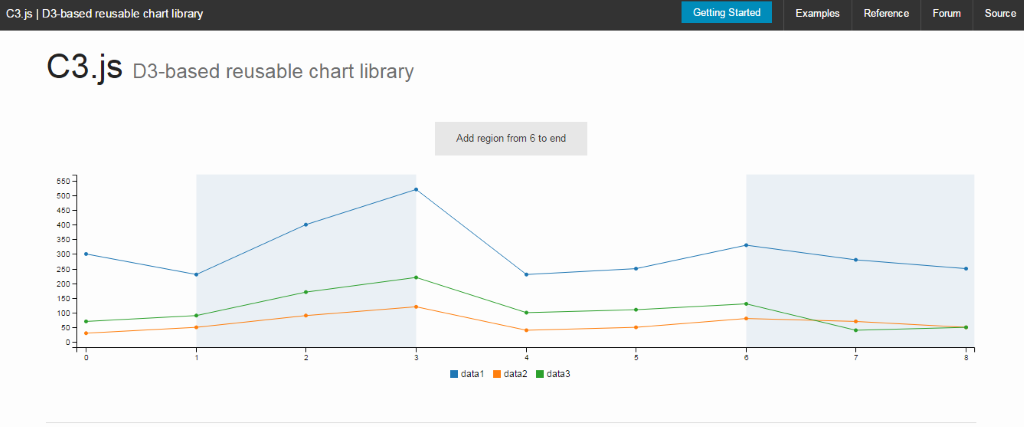
9. C3.js
C3.js is also based on the D3 chart library, and this makes it highly reusable. The total count of D3 established charting tools shows the high usage of D3 functionality, and on the contrary, not many use it for coding directly. C3.js wraps the code needed in the construction of the whole chart and gives you a chance to customize classes used in the generation of different styles based on your preferences. It is opensource and has a couple of callbacks and APIs used in updating the chart.
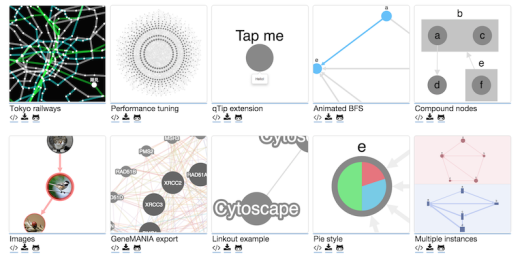
10. Cytoscape.js
Cytoscape.js is a free, fully highlighted graphing library coded in JavaScript. It is optimized and fully independent. You can create a reclaimable graph widget that can be amalgamated with your personal JavaScript code. It’s compatible with present-day browsers and other software frameworks like AMD, Common JS, and Meteor.
11. Cubism.js
Cubism is the best D3 plugin used in visualizing the timing chain. Its standouts can place data from multiple/ different sources like cube and graphite to construct a here and now dashboard used in data visualization. It provides incrementally, using Canvas in transferring charts a single pixel on the left. Its horizon charts utilize vertical space in a better way than common area charts. This allows you to view more data points at a time, thus increasing the chances of discovery.
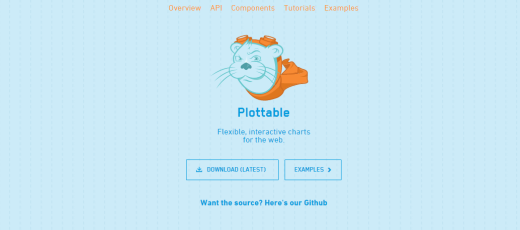
12. Plottable.js
Plottable utilizes a different point of view from that of the D3 framework. It is modular and has pluggable components used in the encapsulation of rendering logic. It is then input in a different structure engine for actual positioning. In Plottable, you can pick a plottable component, add it to an existing chart or manufacture a new one with it.

13. Fusion Chart
Fusion chart has overall JavaScript libraries, 900 maps, and at least 90 charts that users can use anywhere. It also has beautiful charts and a robust reporting experience using its dashboard. It is compatible with Macs, PCs, Android tablets, iPhones, and all browsers, including traditional ones like IE6. Fusion chart extensions are easier to use in integrating any technology such as Angular JS, PHP, jQuery, and Rails.
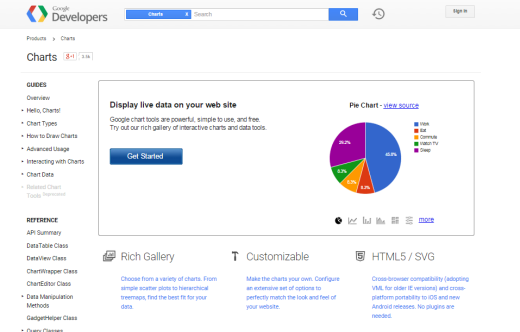
14. Google Charts
Google charts give you a large scope of charts for all data visualization required. Its charts are created on VML and HTML5/SVG for back I the day IE versions.The charts are plannable, zoomable, and interactive.
15. Dygraphs
Dygraphs is a free JavaScript charting library that is used for enormous data sets. It is interactive, has zoom, and pinch on all devices, including mobile ones. Dygraphs cooperate with present-day browsers, and rearward cooperate as far as with IE8. Its custom callbacks and options make it very configurable.
16. Highcharts
Highchart is a popular charting library that is interactive, based on VML/SVGHTML5, and does not require additional plugins. It supports a wide scope of charts such as bar, maps, columns, angular gauges, and spline. It has a Highcharts cloud interface used in the formation of interactive charts on the internet.

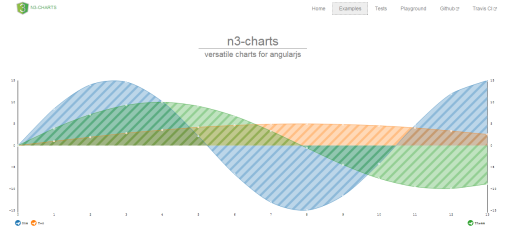
17. N3-charts
N3 is constructed on D3.js, and it is meant to be used by a niche audience. This suits you if you want to construct interactive and simple line charts for an Angular JS application. N3 is open source.
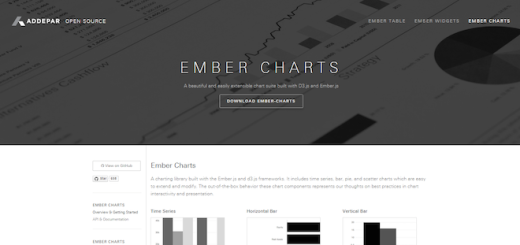
18. Ember Charts
Ember gives you an extensible, easy-to-use chart constructed on Ember.js framework and D3e.js. It is being improved by adding more Ember charts libraries, widgets, and tables. It is polished and powerful; this makes it better in error handling. Ember allows the creation of your personal chart types using extensions.
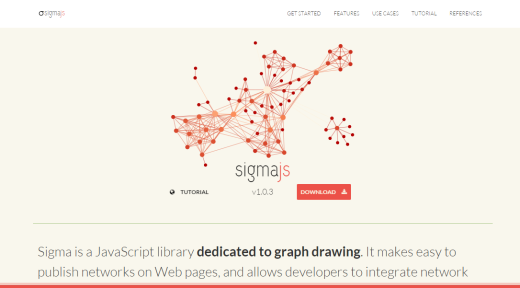
19. Sigma.js
Sigma is a robust JavaScript library used in presenting networks for the internet and interactive graphs. Its plugins and libraries carry with them a vast number of adaptive settings.
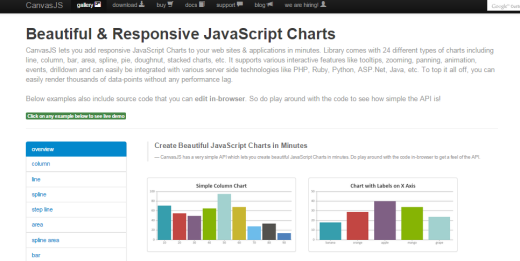
20. Canvas.js
Canvas.js is constructed on HTML5 JavaScript charting library established on Canvas component. It allows you to design rich responsive charts that can display on different devices. It has beautiful themes that are 10x quick than standard Flash/SVG.
Conclusion
Data analysis and visualization are a fundamental part of transactional processes. Organizations require effective ways of data interpretation may they be large or small. It is very crucial to choose JavaScript charting library that suits your needs. Choose a library shown in the article that suits your project.