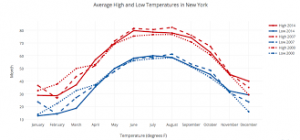
Python continues to make headway in the data industry and in the recent years some useful libraries have been developed and deployed in the market.
Some big winners to this development who include engineers and data scientists will attest to the following Python graph libraries.

1. SciPy
Dedicated to the scientific and engineering sector, SciPy provides you with a reliable library for numerical routines.
Efficiently work on statistics, optimization, linear algebra, as well as numerical integration using SciPy’s specific modules and sub-modules.
2. Pandas
For easy and fast aggregation, manipulation and visualization of data, Pandas definitely stands out.
[gitrepo author=”pandas-dev” repo=”pandas”]
As an ideal tool for data wrangling, Pandas simple and intuitive design will have you effortlessly working on relational and labeled data.
3. NumPy
Numerical Python in full, NumPy is the Python library that will give you the avenue to handle all those scientific tasks you come across.
[gitrepo author=”numpy” repo=”numpy”]
You will find plenty of features in NumPy, you can handle n-array operations, n-array matrices and also apply the NumPy array for mathematical operation vectorization. You will find it quite handy for random number capabilities, Fourier transform, and linear algebra.
4. Matplotlib
This top Python library will generate for you visualizations that are not only simple but powerful as well. With its customizable features, Matplotlib will produce for you legends, grids and labels or any other entities with ease.
[gitrepo author=”matplotlib” repo=”matplotlib”]
By aiming at making the hard thing possible and easy things easier, a few lines of code will generate bar charts, plots, error charts, histograms, scatterplots, power spectra and much more.
6. Seaborn
Seaborn is a python library whose main focus is on creating visuals for statistical models. An example is a heat map that displays overall distributions though being a summary of data.
[gitrepo author=”mwaskom” repo=”seaborn”]
With its high-level interface, Seaborn will give you statistical graphics that are quite attractive.
7. TensorFlow
With TensorFlow you will have computation done by the use of data flow graphs which results in machine learning that is scalable.
[gitrepo author=”tensorflow” repo=”tensorflow”]
TensorFlow’s architecture is flexible and without rewriting of any code, allows you to deploy computation across multiple CPUs or GPUs within a mobile device, desktop or server.
8. SciKit-Learn
SciKit-Learn a Python library built on SciPy brings you specific Machine Learning facilitation and image processing functionalities.
SciKit-Learn is easy to use and its library puts together good documentation and quality code to ensure high performance and desired results in math related operations.
9. Theano
This compiled Python package works smoothly on all architectures to enable you to apply its functionalities of defining expressions, math operations, and multi-dimensional arrays.
[gitrepo author=”theano” repo=”theano”]
Theano performs fast data-intensive computation efficient and symbolic differentiation by optimizing CPU and GPU use.
10. Plotly
Plotly is built to create visualizations that are web-based and for you to use this tool you must set up your API key.
[gitrepo author=”plotly” repo=”plotly.py”]
With Plotly you can style compose, edit and share out interactive graphs or visualizations through the web
The above list sure contains most of the popular Python graph libraries though there are several more out there and even more being developed each day


