23 Best System Monitoring Tools for Linux

Linux is a great platform to run system monitoring tools, but you can’t always trust the default tools installed with your distribution. So we’ve compiled this list of the 23 best system monitoring tools for Linux that will help keep your servers and network up and running.
For a business to run successfully, it is essential to have the ability to maintain computer networks and infrastructure.
As a result, you require an effective system monitoring tool that allows you to monitor the system performance and activity of any device connected to the network.
The Internet is overflowing with options for monitoring systems and applications. This list of the Best Linux Monitoring Tools has been compiled to provide a brief overview of the best monitoring tools.
Begin your journey with the Best Linux Monitoring Tools.
1. Gnome System Monitor
Gnome System monitoring tool is a graphical process viewer for Linux. It shows a list of all running processes and their CPU, memory, swap and disk usage. It also displays network traffic and top processes per user.
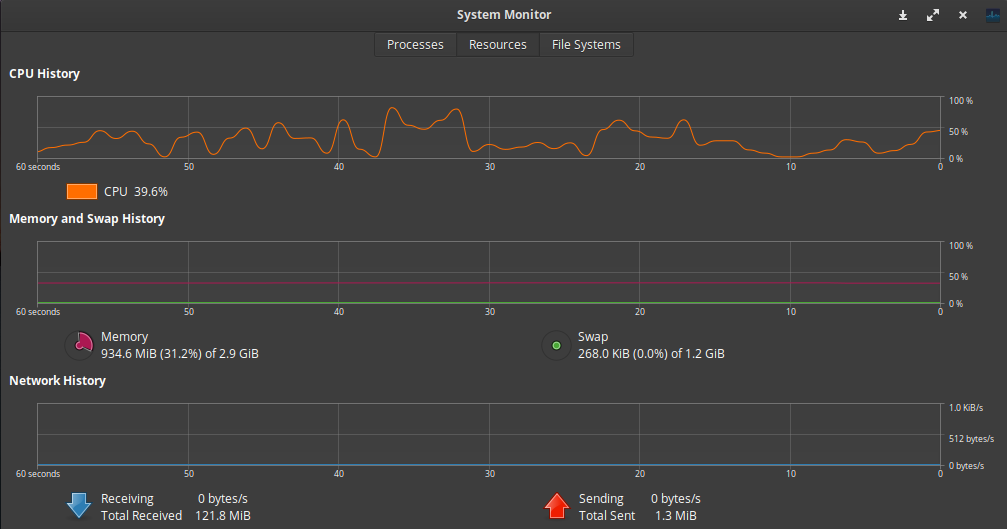
Gnome System Monitor can be used to monitor the health of your system in real-time, including:
Network performance (upload/download speed)
CPU utilization (number of threads)
Memory usage (amount of RAM, available swap space) Disk usage (number of files, space used by each file) Processes running on your system
Processes running on your system are listed in the Processes tab, along with their CPU, memory, swap, and disk usage. The columns can be rearranged by dragging them to a new position. You can also sort processes by clicking on the column headers.
The Processes tab also displays the current number of threads, as well as the name, user, and state (running/stopped) of each process.
The CPU Usage graph shows current CPU usage in real-time and can be expanded by clicking on it to see details by a thread.
The Network tab displays a list of all network interfaces and the amount of traffic they are currently transmitting or receiving. You can expand each interface to see more details on bandwidth usage.
The Memory tab shows you the total amount of RAM available and used by your system. You can also see how much swap space is being used, in addition to the amount of free memory.
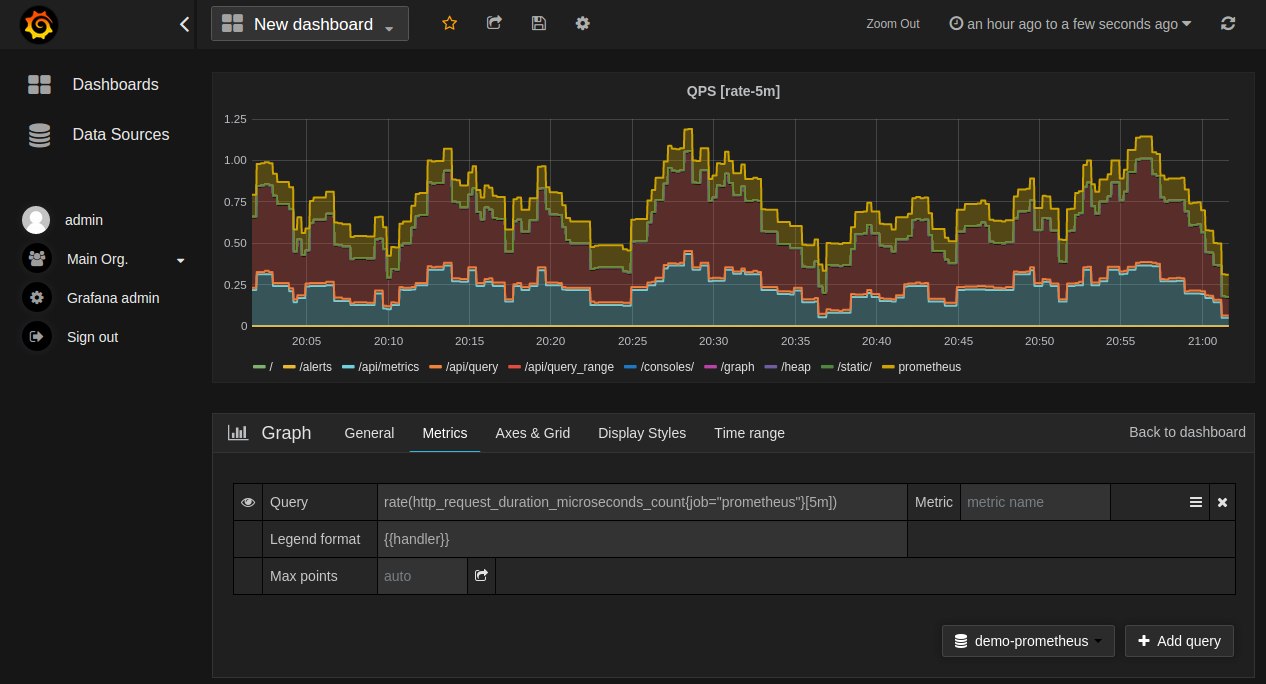
2. InfluxDB + Grafana
InfluxDB is a time series database that allows you to store and access your data in real-time. Grafana is an open source graphing and analytics platform that enables you to analyze data from InfluxDB, as well as other sources.
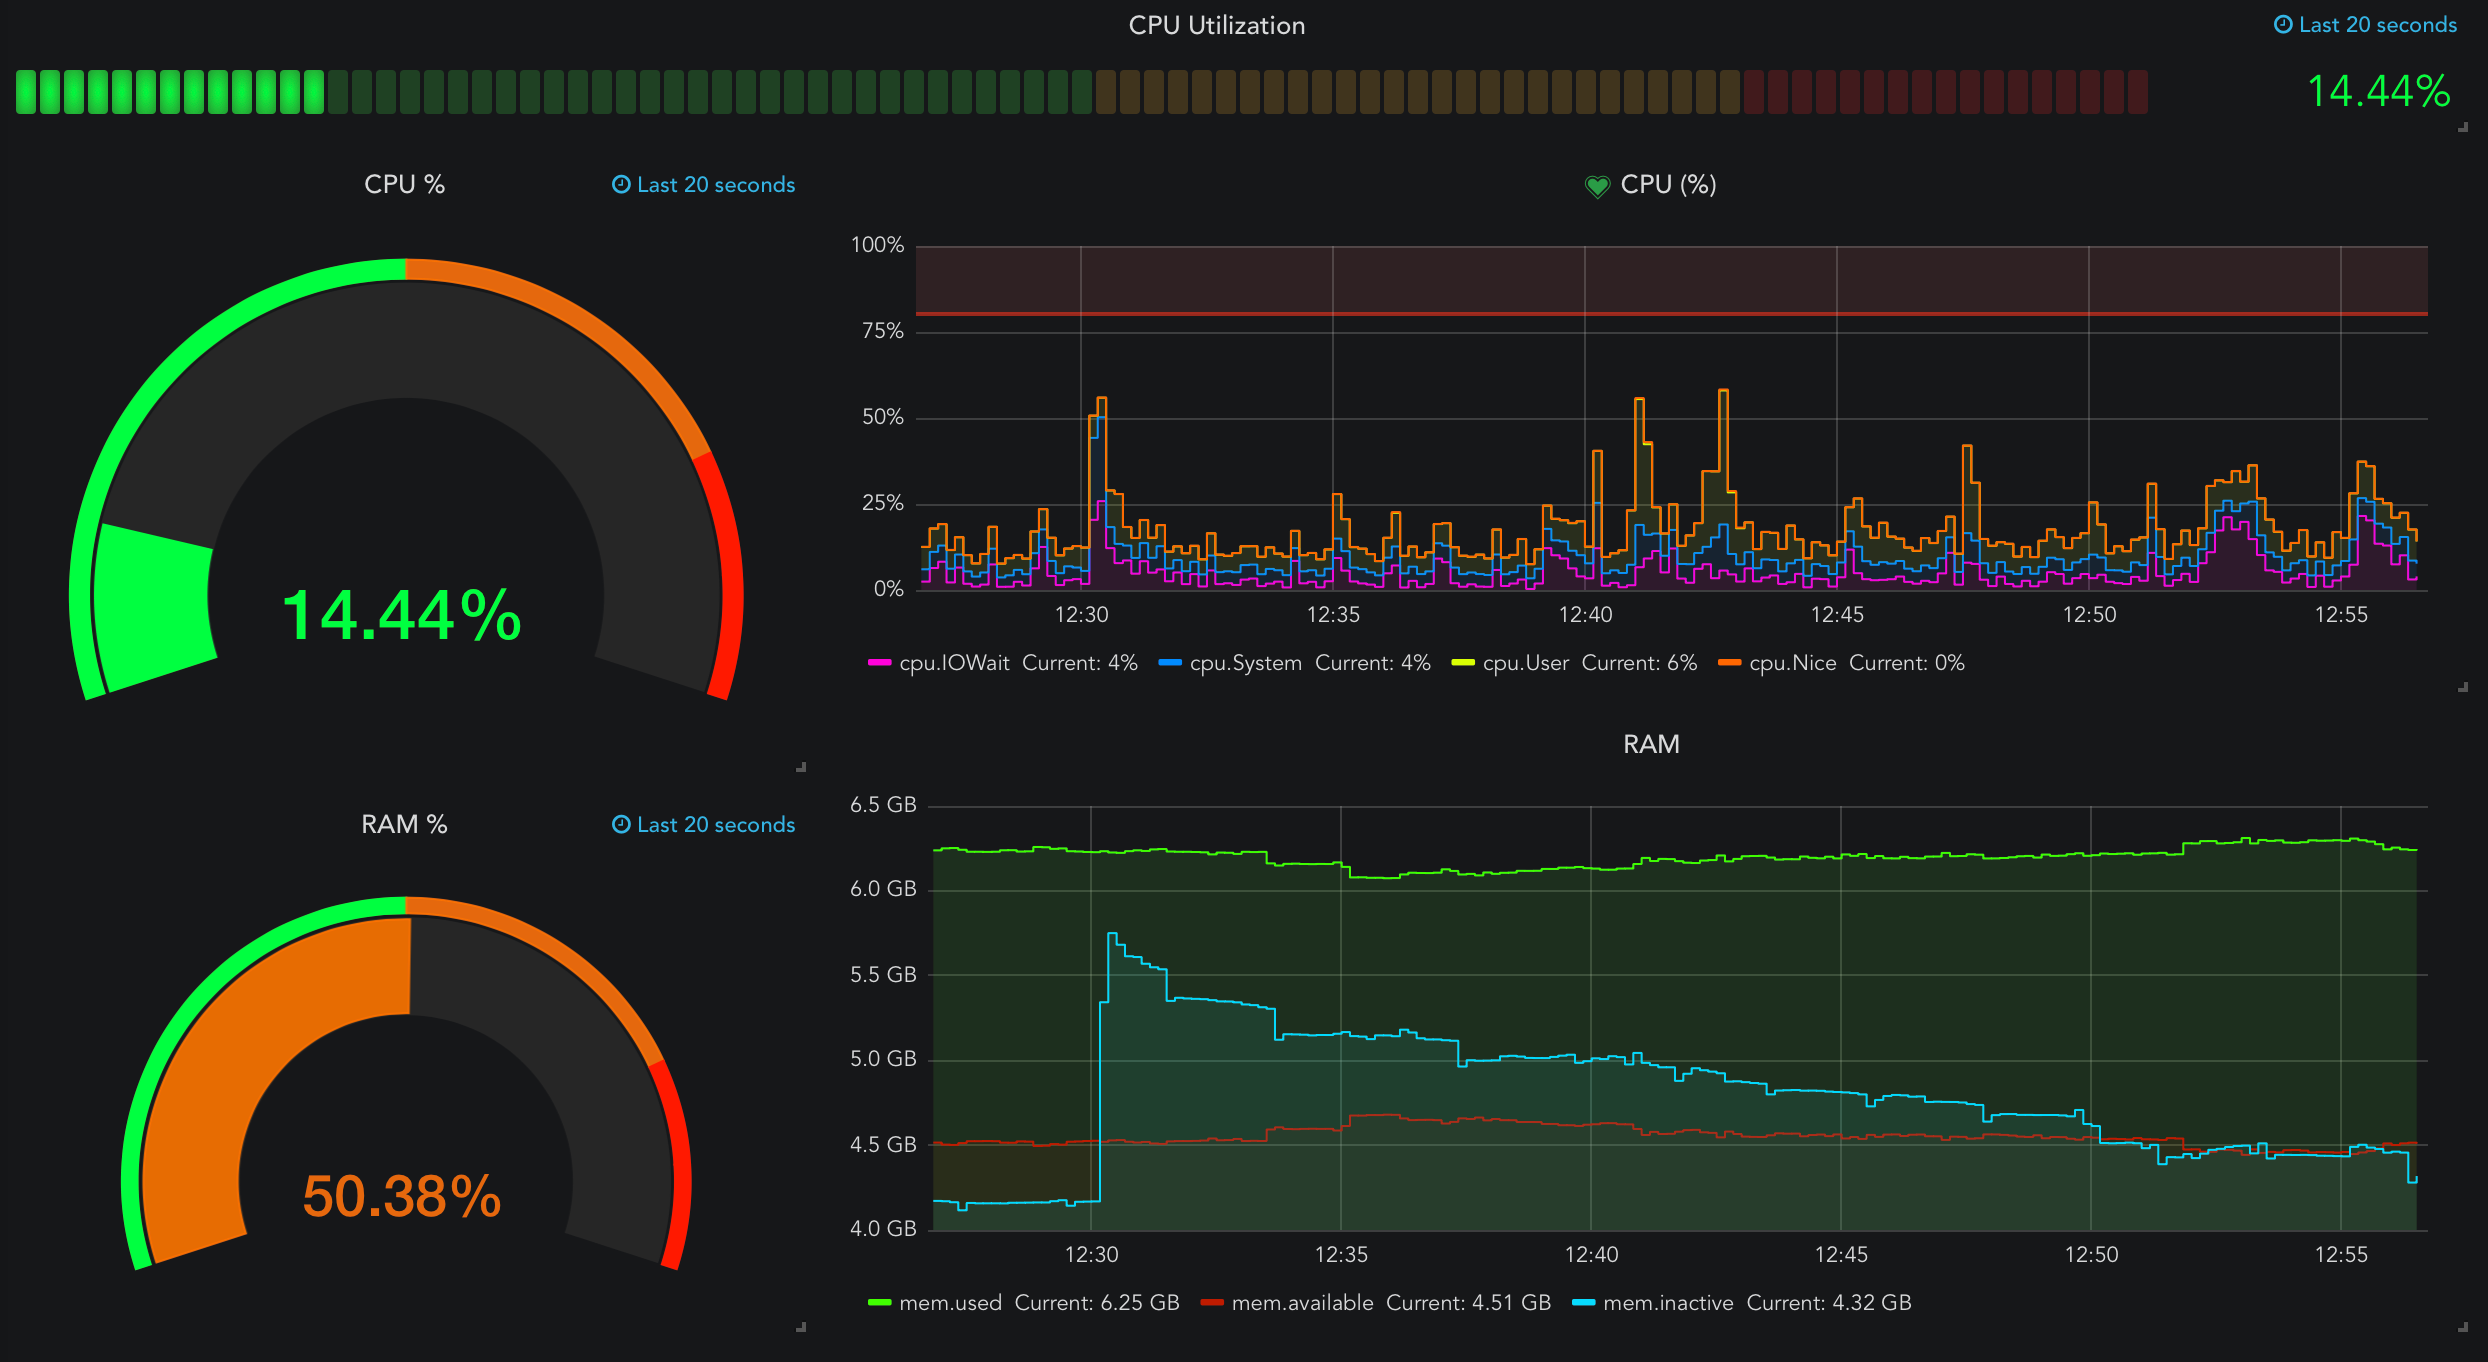
Grafana lets you visualize your time series data in multiple ways: by using dashboards, heatmaps, gauges, and more.
You can see how many users are connected at any given moment or which metrics are increasing over time (and which aren’t).
You can use Grafana to create dashboards and visualize your data, which will help you make better decisions.
3. Tivoli Monitoring
Tivoli Monitoring is a software suite that provides the ability to monitor, manage and control IT infrastructure.
It was developed by Tivoli Software’s Enterprise Monitoring division as a part of its Tivoli Enterprise system monitoring tool suite.
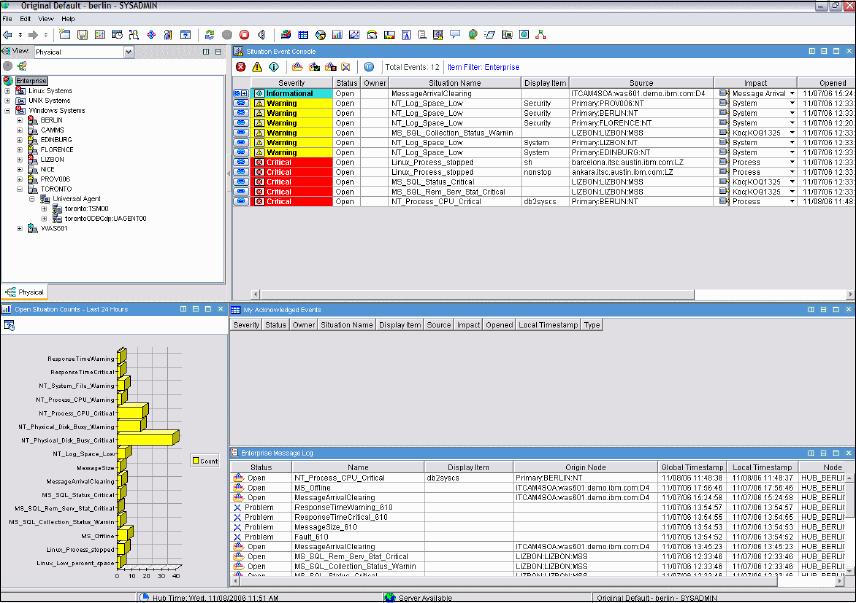
Tivoli System Monitoring tools offer agents for Linux, Windows, and Solaris operating systems, as well as two core platforms: one for monitoring applications (the Resource Manager) and another for managing physical devices (the Device Manager).
The Resource Manager agent can be used with any application server or database that supports SNMPv2/3; however, it does not support SNMPv1 or IPv6 protocols at this time.
The Device Manager agent can be used with any device that supports SNMPv1 or SNMPv2/3. It also includes a Java-based console for managing the agents and viewing their results.
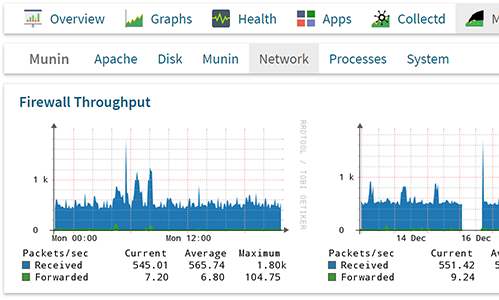
4. Cacti
Cacti is a complete network graphing solution designed to harness the power of RRDTool’s data storage and graphing functionality.
The project originally started as an effort to create a new frontend for RRDtool that would be easier to use than the existing ones available at the time (and still available today).
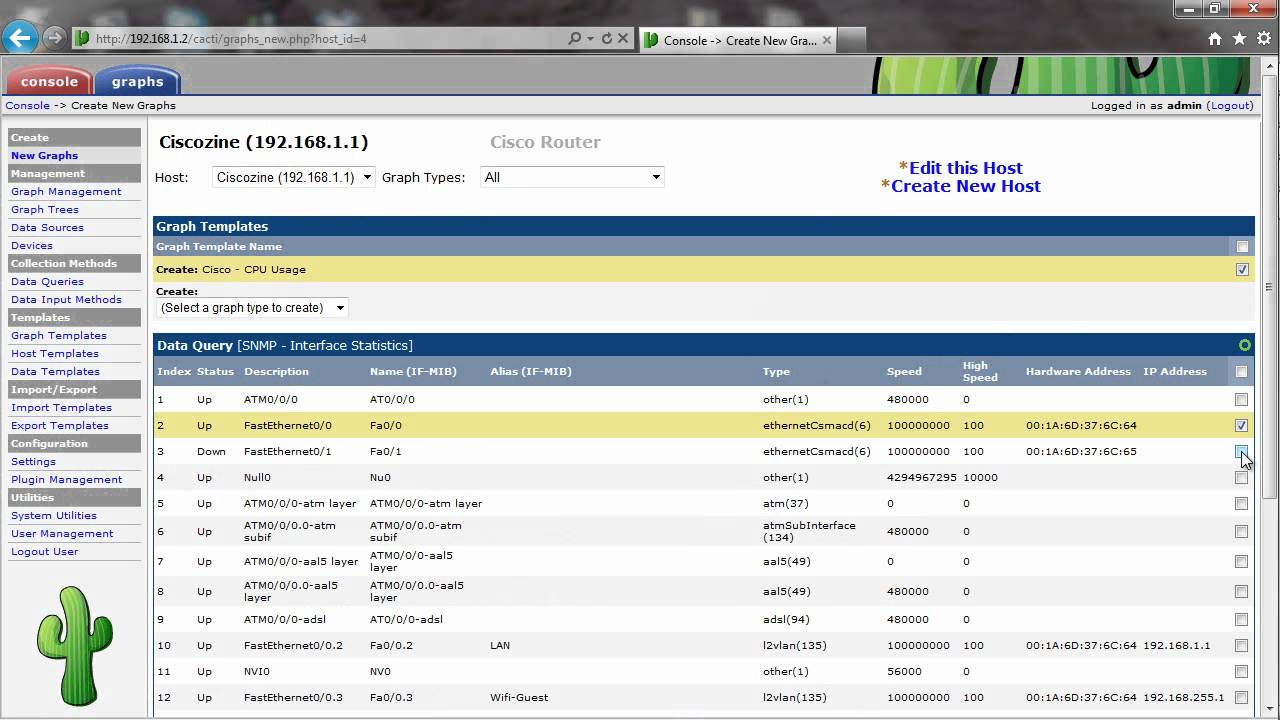
Today, Cacti has grown into one of the most popular open source monitoring solutions on Linux.
It provides a fast poller, advanced graph templating, multiple data acquisition methods (including SNMP), user management features out of the box as well as many other useful tools for collecting information about your systems or network devices like uptime sensors or pingers for each interface on your server(s).
The system is highly customizable and allows you to create graphs with custom fields that are not supported by default.
It also includes an extensive user management system which can be used for authentication or authorization, as well as other useful features such as email notifications about events on your network.
5. LibreNMS
LibreNMS is like a dashboard for your network, where you can see the health of your network devices and identify any issues quickly.
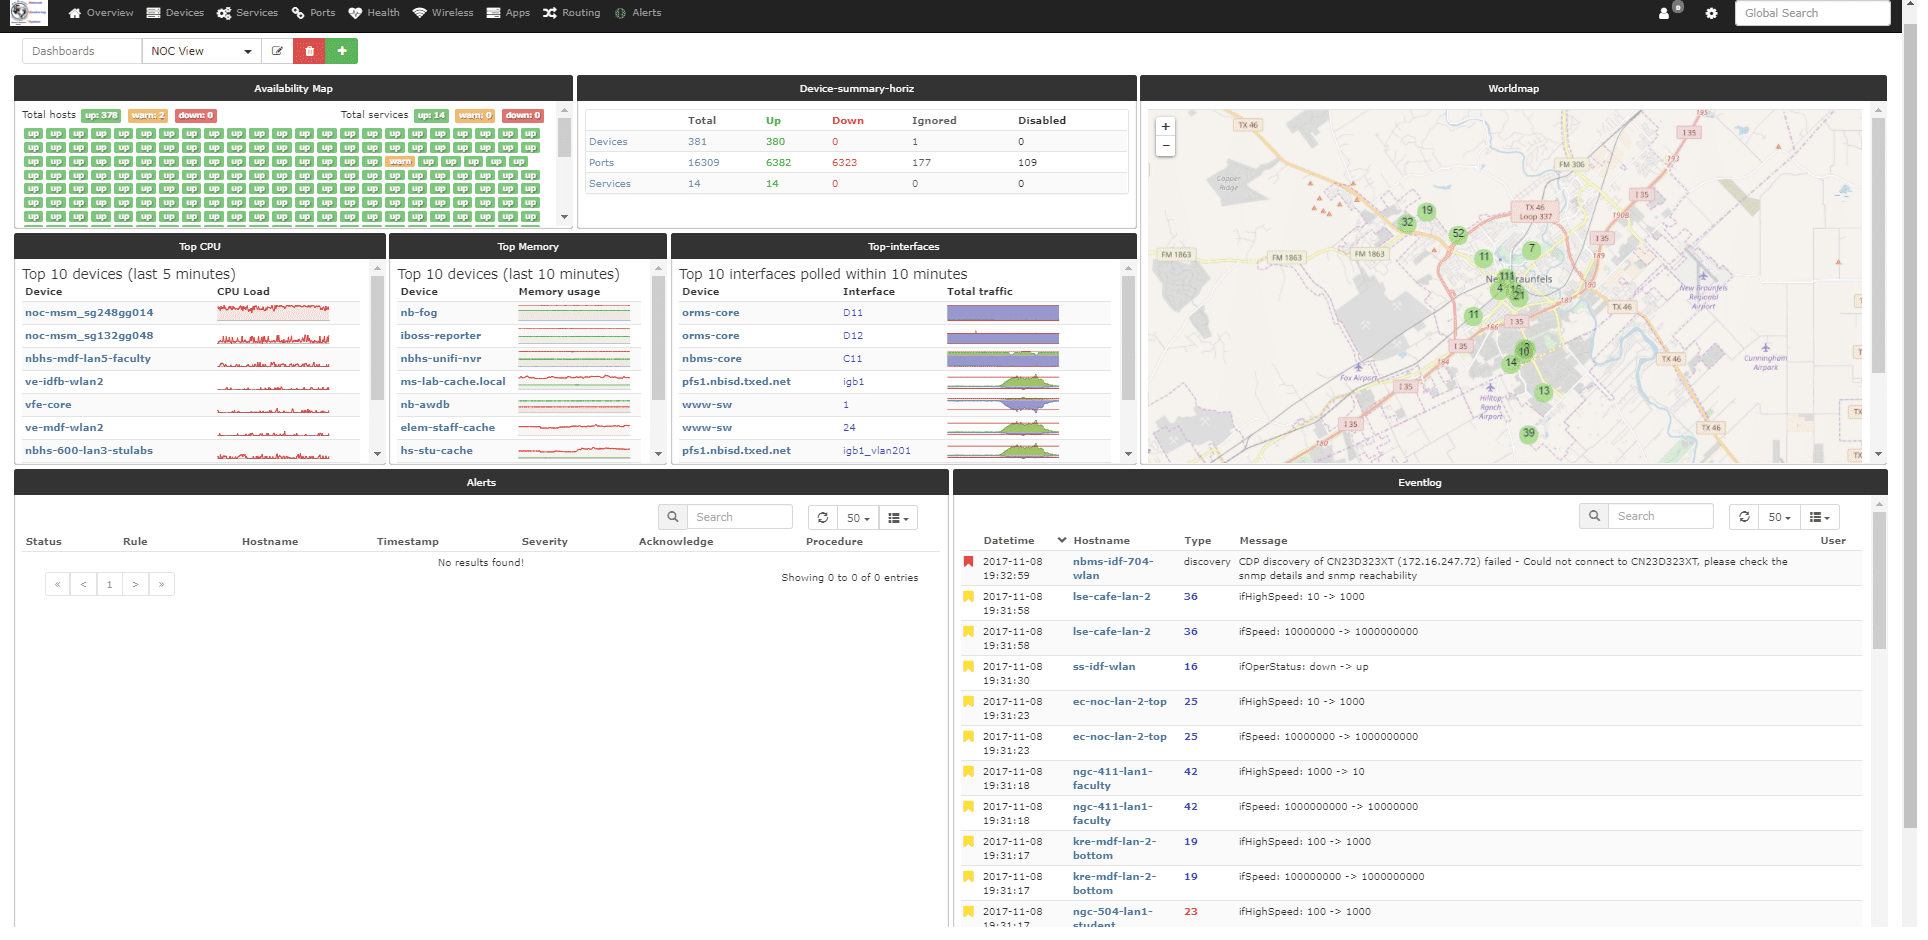
LibreNMS discovers your entire network using CDP, FDP, LLDP, OSPF, BGP, SNMP and ARP.
It is compatible with several operating systems, including Linux, FreeBSD, and network devices such as Brocade, Foundry, HP, Cisco, Juniper, and many more.
With LibreNMS, you can monitor the availability and response time of your network devices, see the utilization of network bandwidth, and receive alerts when something goes wrong.
It provides real-time monitoring of network devices, so you can see their status and performance at a glance.
You can also customize it to fit your needs, with options for customizing graphs, reports, and alerts.
LibreNMS has an active community of users and contributors who can help you with questions or problems.
6. Nagios Core
Nagios Core is one of the best system monitoring tools that can monitor systems, networks, and applications. It’s one of the most popular open source software monitoring tools for system administration, IT operations, and service management.
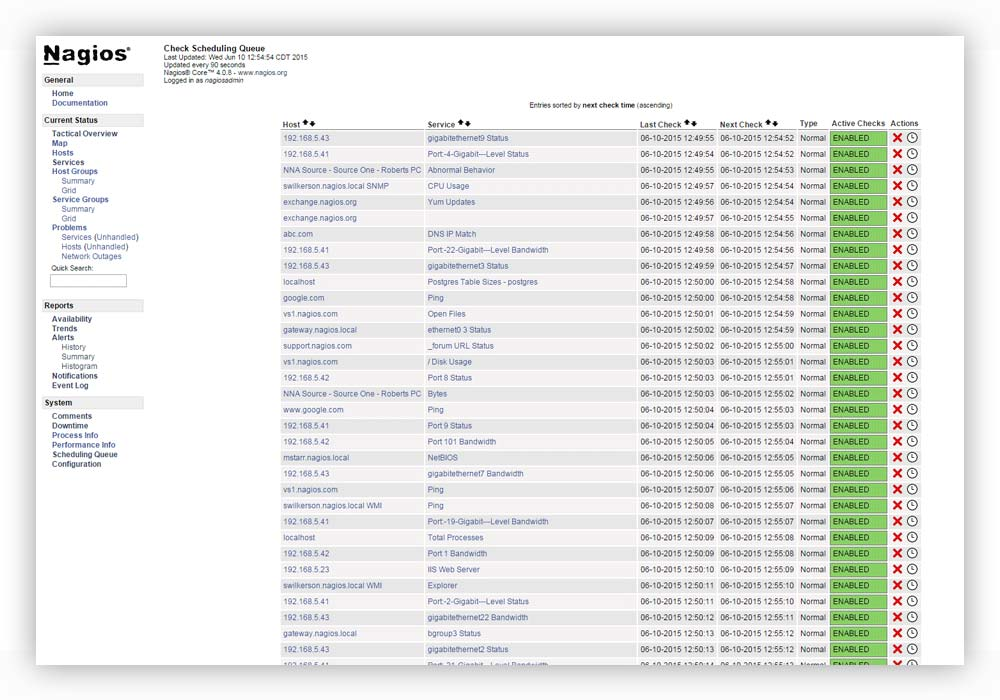
Nagios Core can be used to monitor Linux servers as well as Windows machines via WinCC (Windows Command Center) or in combination with iChecker.
This makes it an excellent choice for organizations that have mixed environments with both Linux and Windows-based machines since you can use either method to keep track of your infrastructure—and even configure it differently depending on whether you’re working on a Windows machine or not!
Nagios Core is an enterprise-grade Linux monitoring tool because it offers features like host groups which allow multiple hosts to share information about each other’s status without having access directly to their respective databases.
It has supervisory integration; web interface support; graphing capabilities; integration with other services such as fan control through Lm_sensors – which monitors temperatures inside hard drives – although these features aren’t available by default out-of-the-box unless one purchase extra licenses specifically designed just for this purpose.”
7. Nagios XI
Nagios XI is a powerful solution for monitoring large networks. It has a great user interface and can be used to monitor multiple servers, services, processes, and applications on your network.
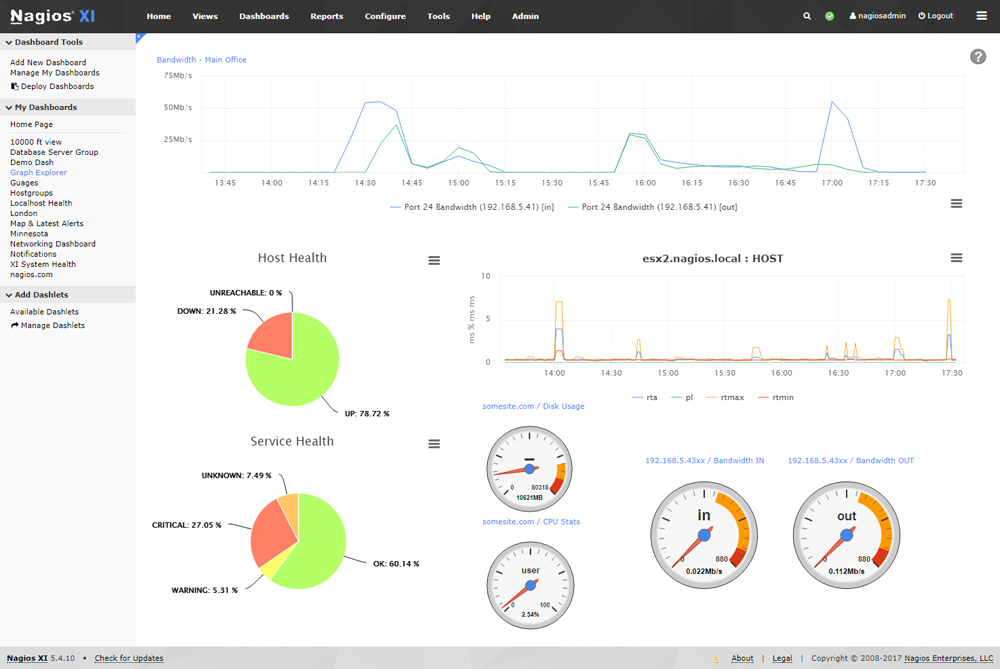
Nagios XI also has many add-ons that allow you to customize how it works by adding custom checks or rules specific to your business needs.
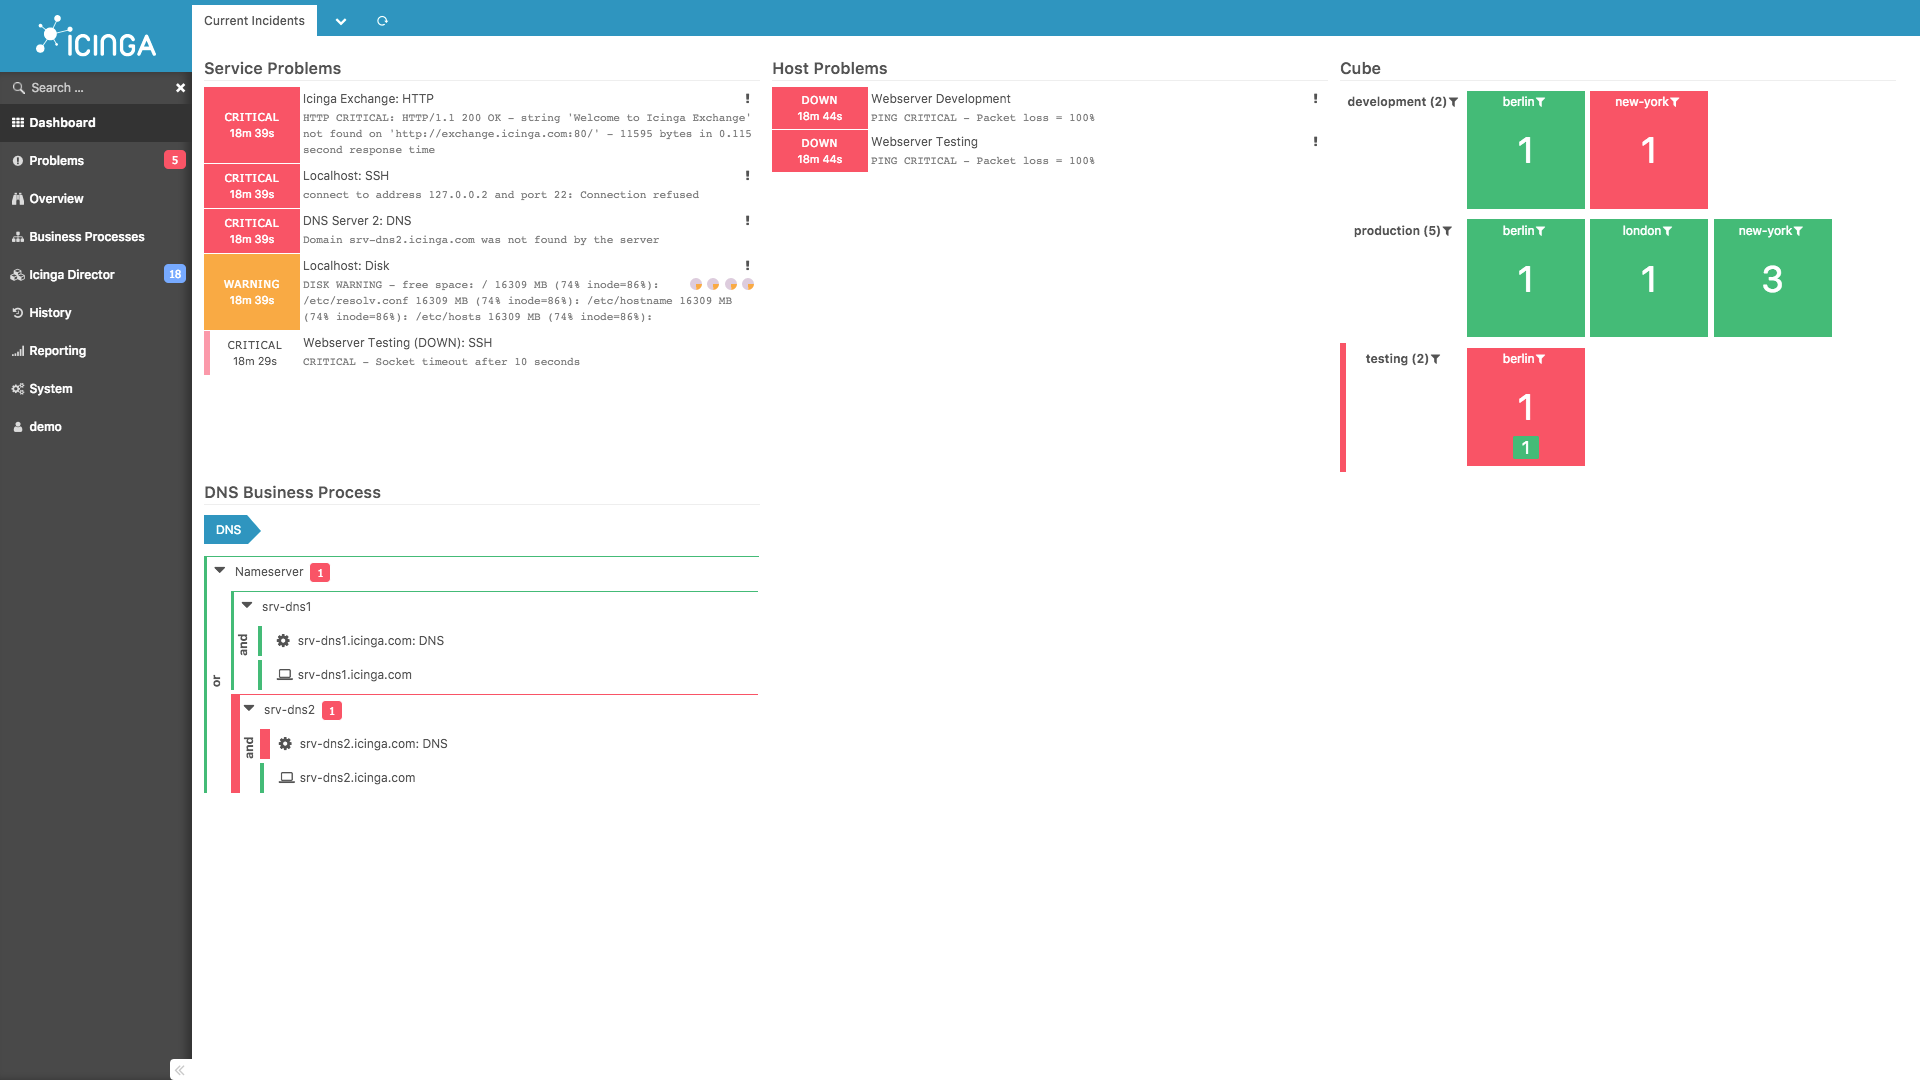
8. Icinga 2
Icinga 2 is a network monitoring system. It’s an open source tool for Linux servers and network devices, designed to be flexible and robust. The core of Icinga 2 consists of two parts: the agent daemon ( icinga2 ) and the Web-based management interface ( icingaweb2 ).
Icinga 2 has been developed by EMC Corporation’s Talon Team in collaboration with the community since 2009, but it’s no longer supported by them anymore.
A fork called Nagios Core was created from this project in 2013; Icinga 2 is now considered as one of its descendants.
Icinga 2 provides real-time monitoring for your systems using SNMP configuration files, CLI commands or XML definition files (the latter ones only if you install OpenSCAP).
Nagios is an open source system monitoring tool that allows you to monitor your network infrastructure, services and applications. It has a great user interface that makes it easy for you to manage all of your monitored devices from one place.
It is designed to be flexible and robust, so you can use it in any kind of environment. The core of Icinga 2 consists of two parts: the agent daemon ( icinga2 ) and the Web-based management interface ( icingaweb2 )..
The icinga2 daemon runs on each host that you want to monitor, and it sends status information to the central Icinga 2 server.
9. Zabbix Agent
Zabbix Agent is a simple and lightweight monitoring agent for Linux, Windows and macOS.
It can be used to gather information about your system’s availability and performance both at the machine level and on a per-service basis.
The agent also supports reporting in multiple formats such as HTML, XML or JSON.
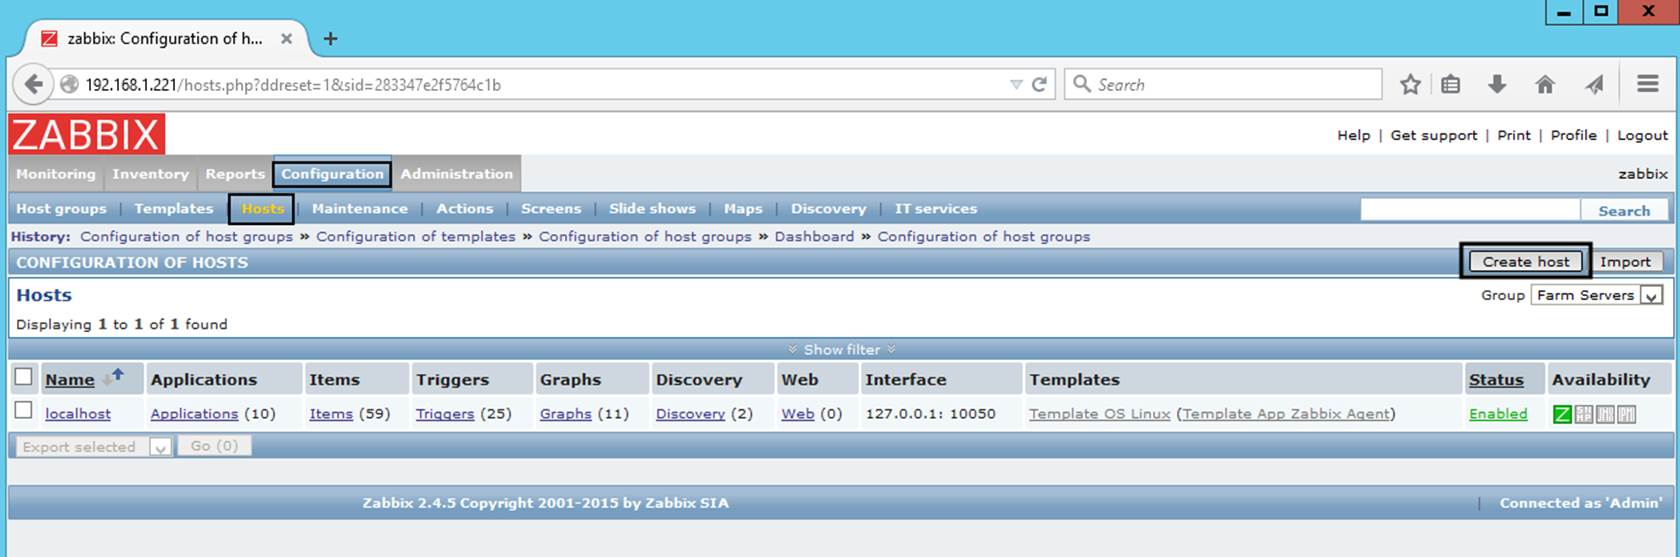
Zabbix Agent is an open source software that was developed by Zabbix project contributors from all over the world who volunteer their time to improve this tool.
The agent is written in C and has no dependencies other than a standard Linux installation. It can be used on any platform that supports gcc, such as Linux and BSD distributions. Zabbix Agent performs various checks on your system and sends them to the Zabbix server in JSON format for further processing.
10. WhatsUp Pro Server Monitor
WhatsUp Pro Server Monitor is a multi-platform tool that monitors your Linux servers and cloud services. It offers both a GUI (Graphical User Interface) and command line interface, making it easy to use on any operating system.
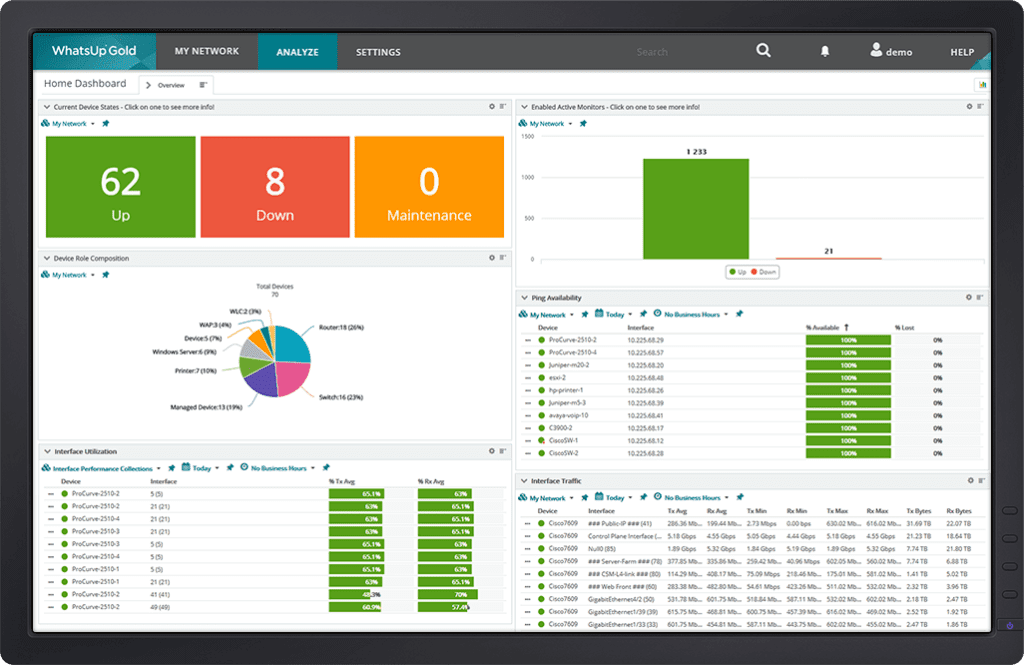
The free version comes with basic monitoring tool features, but if you want more advanced features or just want the ability to monitor multiple servers at once, then the paid version is worth checking out.
While this tool does not offer many advanced features, it is a good option for those looking for a simple solution that works well.
The most popular feature of this monitoring tool is its ability to monitor CPU usage.
It will send you an email notification when your CPU hits a certain percentage, letting you know that it may be time to upgrade your server or add additional resources.
The tool also tracks memory usage and network activity as well as processes running on each server.
11. NetBox
NetBox is a network inventory management software that allows you to manage all your network devices in one place. It can be used on Linux, Windows and Mac and it lets you create custom reports and dashboards.
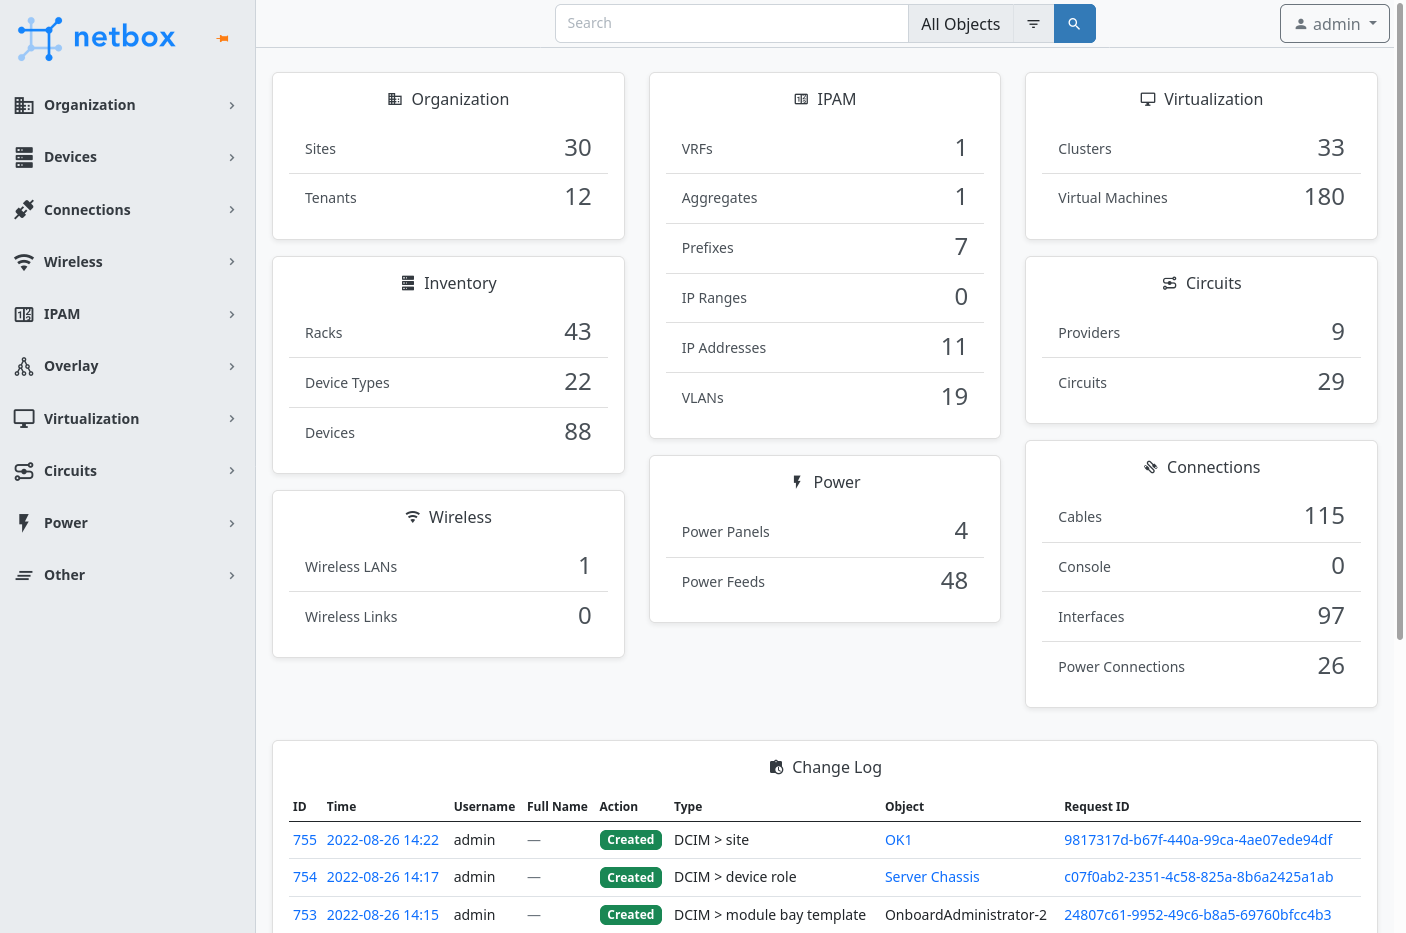
NetBox helps organizations manage their networks by providing visibility across the entire IT environment. The software gives an overview of all IT assets, including servers, workstations, printers and more so anyone within an organization can understand what’s happening with their technology assets at any moment in time
. NetBox is an open source network inventory management software that allows you to manage and monitor all your network devices in one place. It can be used on Linux, Windows and Mac and it lets you create custom reports and dashboards.
12. ServersCheck monitoring software
ServersCheck is a monitoring tool for Linux and Windows servers. It’s a free open-source monitoring tool that’s easy to install and use, with an intuitive user interface. ServersCheck provides alerts and notifications, so you can be notified when something goes wrong in your system.
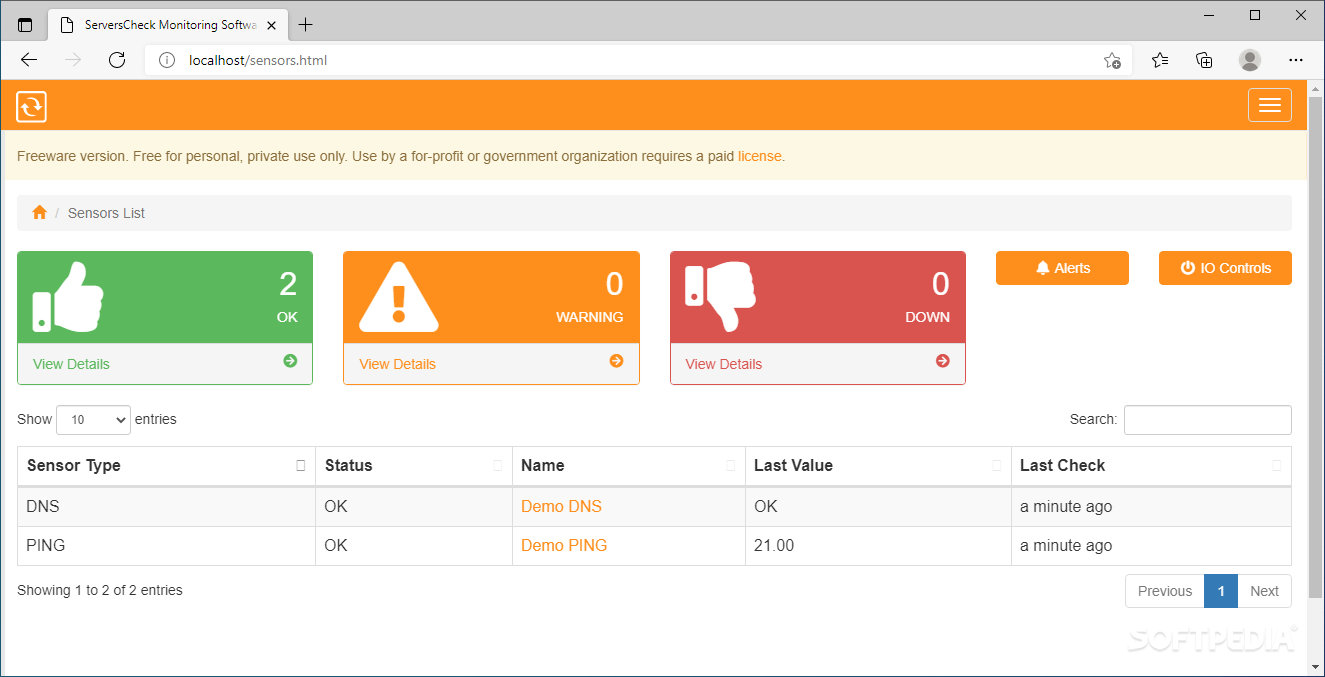
ServersCheck also has a community forum where users can discuss issues they’re having with the software or share their own knowledge on how it works (you can even post tutorials).
ServersCheck is not a complete linux monitoring solution, but it’s a good starting point. It can alert you when critical services on your servers go down, but it doesn’t provide details about what’s causing the problem.
In addition to monitoring tool, ServersCheck can monitor CPU usage, memory usage and network traffic. It also allows you to set up alerts for when these values exceed certain thresholds.
13. Sysdig Monitor (Formerly Papertrail) – Free and Paid Option Available
Sysdig Monitor is a monitoring tool for Linux, Docker, and Kubernetes. It provides detailed visibility into the real-time performance and behavior of your servers and applications which can be utilized by system administrators to troubleshoot issues or proactively identify problems before they become an issue.
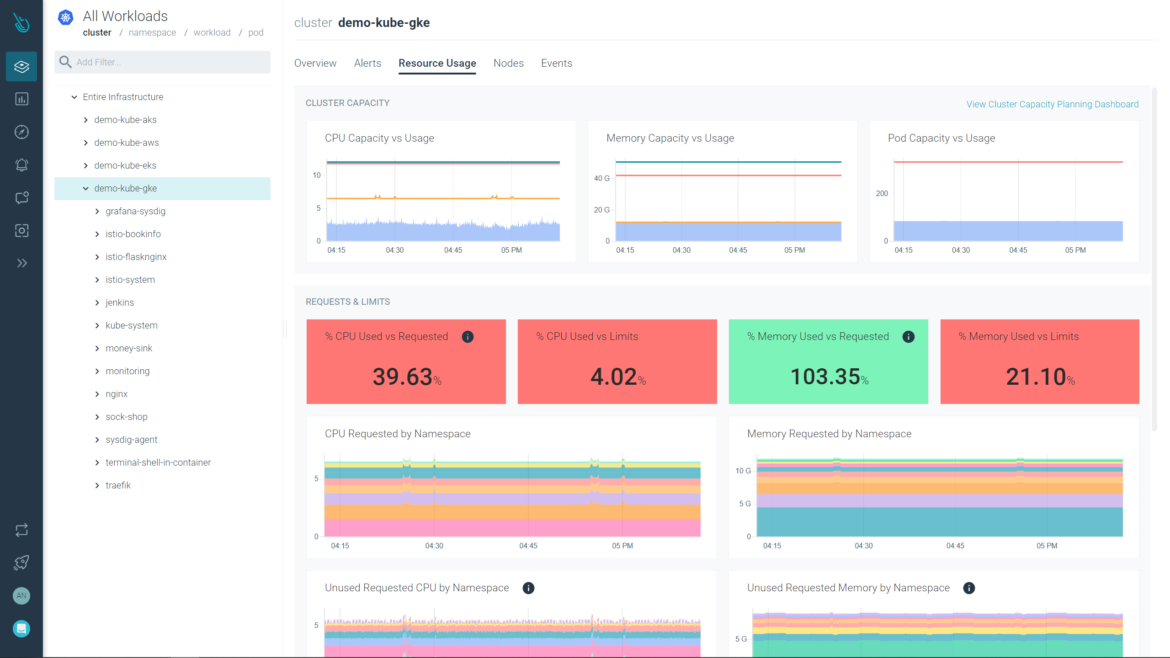
Sysdig Monitoring tool uses its own open source agent called sysdig-agent that runs on each host in order to collect information about network traffic (TCP/UDP), disk I/O performance, CPU utilization and more. This can then be used in conjunction with other tools such as Prometheus Alertmanager or Grafana Dashboard so that you have full control over what data gets collected from your environment without having to manually configure it every single time you run an application!
14. PRTG Network Monitor
PRTG Network Monitoring tool is a Linux performance metering software that uses sensors to track traffic to your network such as CPU loads and storage space.
In Linux servers, the sensor typically require
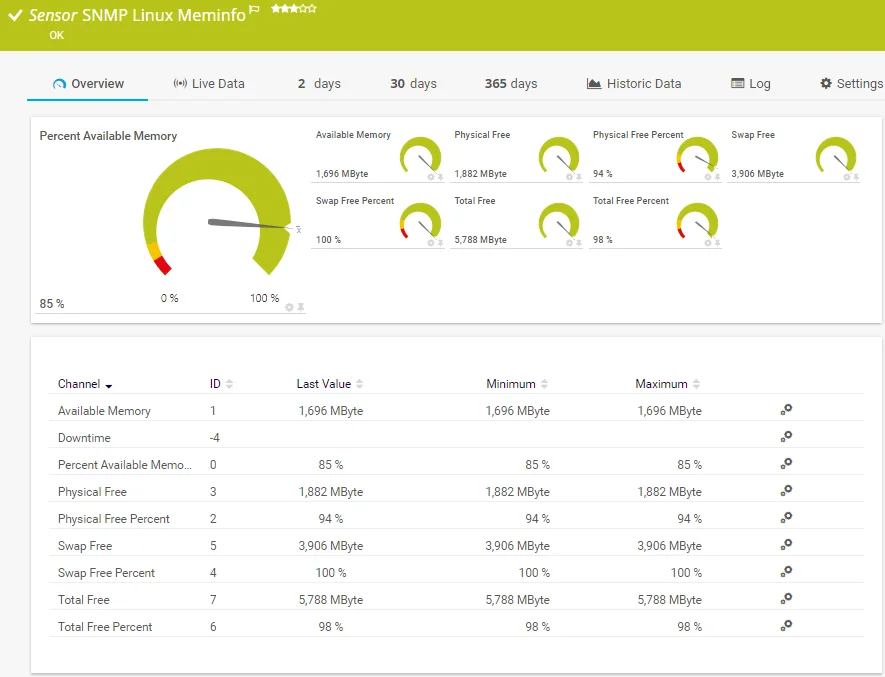
It monitors any Linux server, including integrating with custom sensors with WBEM SSH and the Sylog protocols. SSH sensors can track free diskspace and load averages as well as the amount of storage on your server. The dashboard provides further details of your servers status and performance, notifying you when problems arise. Pro Cons Pricing.
15. Monitorix – System and Network Monitoring
Monitorix is a free monitoring tool for running system and network resources on Linux servers. It features a web server which collects system information and graphs.
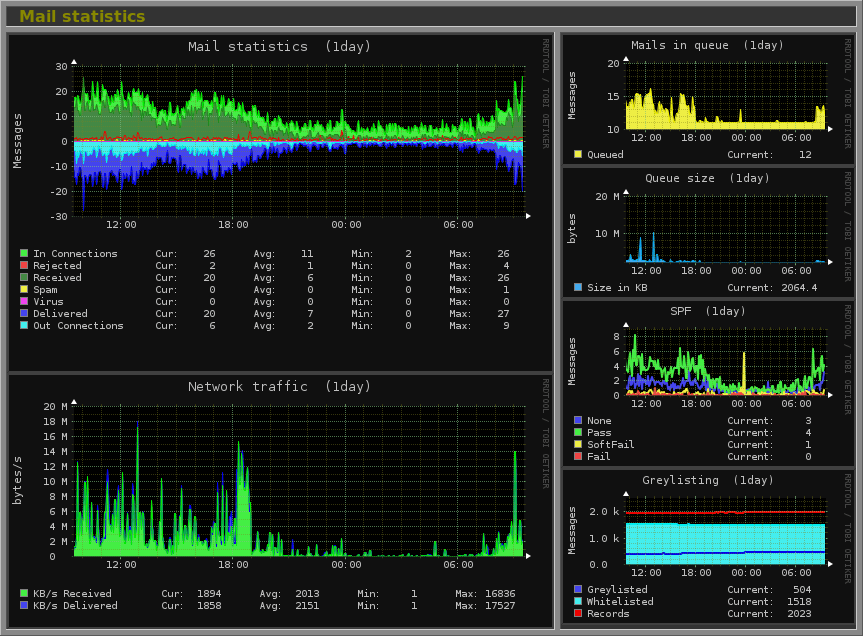
Monitors system load average and utilization, memory allocation, driver health and other systems services. Specifically, the software monitors overall system performance and helps detect problems such as bottlenecks and other abnormal behavior. If you need any additional information about Monitorix and other monitorix applications, you can download the application.
16. Logwatch
Logwatch is a log analysis and reporting tool for Linux systems. It parses log files from various system services, such as Apache, SSH, and syslog, and generates a report summarizing the important events that have occurred.
The report is designed to be easy to read, with a clear and concise summary of the most important information.
Logwatch can be used by administrators to:
Monitor common system activities over time
Perform security audits of individual services or web applications
Identify unusual activity in response to specific events
17. Prometheus and Grafana
Prometheus and Grafana are used together as an open-source monitoring and alerting solution with support for Linux servers.
Prometheus is a monitoring tool that collects metrics from various sources and stores them in a time series database. This database can be viewed using Grafana, which provides a dashboard for viewing graphs of collected data.
Grafana is an open source monitoring tool that collects metrics from various sources and stores them in a time series database. It provides a dashboard for viewing graphs of collected data.
18. Observium community
Observium is a Linux network monitoring and management platform that provides real-time insight into network health and performance.
Observium can automatically discover network devices and services, collect performance metrics, and generate alerts when problems are detected.
It also supports a wide variety of operating systems and uses SNMP network monitoring.
Observium Community can also generate reports and send alerts when issues are detected.
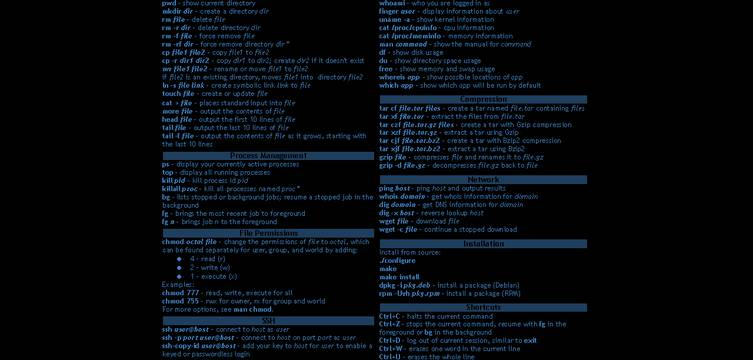
19. dstat
dstat is a one-of-a-kind tool that provides comprehensive statistics about your Linux system. It’s like an all-in-one resource monitor that can replace multiple other tools. With its extra features, customizable counters, and high level of extensibility, it’s the perfect tool for tech-savvy users, you can even add your own custom plugins to dstat.
Here are some of its standout features:
Displays interrupts for each device in real-time
The ability to monitor multiple statistics at the same time
Highly customizable counters that you can arrange as you see fit
Summarizes grouped block and network devices for a big-picture view of your system
Combines information from tools like netstat, iostat, ifstat, vmstat, and mpstat for a comprehensive understanding of your system’s resources
Accurately tracks performance over time
Display results in color, making it easy to distinguish between different units.
dstat is a versatile and user-friendly tool that provides an unparalleled level of insight into your Linux system.
20. BMW-NG
If you’re looking for a straightforward and flexible Linux monitoring tool, then BMW-NG is the tool for you.
Despite its simplicity it offers powerful bandwidth monitoring capabilities that are ideal for small-network Linux specialists.
It doesn’t have any flashy graphics or color coding, but its straightforward approach is what makes it so effective.
Some key features of BMW-NG include:
Licensed under the GPL2 license, making it open-source and freely available
Supports a wide range of devices and interfaces, with the ability to blacklist specific ones if needed
Display output in a variety of formats, including plain console, CSV, and HTML
Customizable configuration file to meet your specific needs
Display parameters such as average, maximum, errors, and total sum, giving you a clear understanding of your network’s performance.
In summary, BMW-NG is a simple yet effective tool for monitoring your Linux network. It may not have the bells and whistles of other monitoring tools, but it gets the job done and provides valuable insights into your network’s bandwidth performance.
21. EtherApe: An Ideal Network Monitoring Solution for Small Networks
EtherApe is a powerful network monitoring software that is compatible with Linux/Unix systems. If you’re an IT specialist looking to monitor a small network without having to navigate through confusing scripts, EtherApe is the perfect tool for you. With its ability to read packets from the network and from a file, EtherApe supports monitoring devices like WLAN, FDDI, ISDN, and more.
Key Features of EtherApe:
Supports IP, link layers, and TCP modes along with devices like FDDI, Token Ring, ISDN, PPP, SLIP, and WLAN
Provides a color-coded display of protocols, making it easy to understand network activity
Filters traffic and shows only the data you need to see
Can read packets from a file or from a live network
Compatible with Scrollkeeper and rarian
Supports end-to-end IP and port-to-port TCP connections
A summary dialog display that shows traffic statistics node by node
Configurable node persistence time
Supports numerous frame and packet types such as ICMP, IGMP, UDP, IDP, PP, RSVP, GRE, EON, TELNET, FTP, HTTP, NETBIOS, SNMP, TRAIN, LOOP, VINES, and more.
In conclusion, EtherApe is a user-friendly network monitoring solution that provides valuable insights into the activity of small networks. Its color-coded display of protocols, filtering options, and support for multiple devices make it an ideal tool for IT specialists.
22. Pandora Fms
Pandora Fms is a flexible and adaptable network monitoring tool that can be used on almost any operating system.
It offers the option of adding sensors and integrating applications, making it a powerful tool for monitoring your network.
The basic version provides useful graphical analysis, which is not often found in open-source network monitoring tools.
Some of the key features of Pandora FMS include:
Automated mapping of the network
Polling using SNMP v3
easy to integrate multiple applications simultaneously
NetFlow for managing network capacity
An integrated MIB Explorer with the option to load custom MIBs
Historical graphs that can be viewed for up to three years back
The ability to monitor both Windows and Unix computers
Integrated IP addressing management (IPv4/IPv6) through IPAM.
23. SolarWinds NetFlow Traffic Analyzer (NTA)
SolarWinds NetFlow Traffic Analyzer (NTA) is a user-friendly tool that offers visualized bandwidth monitoring to evaluate the network’s capacity and identify any IT-related issues. This software, known for its impressive color-coded and searchable visual data, provides an analysis dashboard that allows you to examine your precise NetFlow data in a clean visual format. NTA also sends traffic-based alerts to help detect any threats in your network, and a free trial is available for 30 days.
Some of its features include:
Alerts you when bandwidth usage surpasses a set threshold
Offers a comprehensive view of all network traffic on a single screen
Lets you quickly identify problems by dragging and dropping network performance metrics
Gives you insight into users and applications that consume the most bandwidth
Generates in-depth network reports
Can be integrated with other SolarWinds products, such as User Device Tracker, Network Performance Monitor, and Network Configuration Manager
Allows you to create and access personalized network traffic data through the Flow Navigator module
Supports a variety of vendors and technologies, including Nortel Networks, vSwitch, VMware, NBAR2, and NetFlow v5.
Conclusion
It is our hope that this article will save you the struggle of choosing the best System Monitoring Tools for Linux that will give you the best results. This article was to help you find the right Linux monitoring tool for your IT infrastructure and business; from Gnome system monitoring tools to real-time alerting systems and unified monitoring suites. All the best in your search and feel free to share this article with your friends.