
In this Tutorial , we will create a Activity Tracker Chart using angular 2 with Chartist to provide a project activity overview over the past 24 hours. This bar chart will only provide some visual clues about the project activity, and our goal is not to make it provide detailed information. For this reason, we will configure it to hide any labels, scales, and grid lines. The only visible part should be the bars of the bar chart.
Before we start creating the activity chart itself, we need to look at how we need to transform and prepare our data for the charts.
Let’s look at what data we already have in our system. As far as the activities go, they all have a timestamp on them stored in the time field. However, for our chart, we want something else displayed. What we’re looking for is a chart that displays one bar for each hour of the past 24 hours. Each bar should represent the count of activities in that timeframe.
The following illustration shows our source data, which is basically a time stream of activity events. On the lower arrow, we see the data that we need to end up with for our chart:
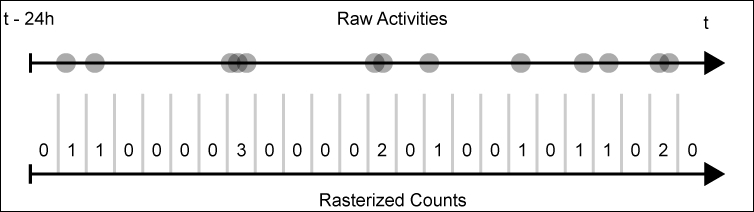
An illustration displaying activities as a time stream where the dots represent activities. The lower arrow is showing a rasterized count by hour for the last 24 hours.
Let’s implement a function that does the transformation outlined in this image. We’ll add this function to our time-utilities module on the lib/utilities/time-utilities.js path:
function rasterize(timeData, timeFrame, quantity, now, fill = 0) {
  // Floor to a given time frame
now = Math.floor(now / timeFrame) * timeFrame;
returntimeData.reduce((out, timeData) => {
    // Calculating the designated index in the rasterized output
const index = Math.ceil((now - timeData.time) / timeFrame);
    // If the index is larger or equal to the designed rasterized
    // array length, we can skip the value
if (index < quantity) {
out[index] = (out[index] || 0) + timeData.weight;
    }
return out;
  }, Array.from({length: quantity}).fill(fill)).reverse();
}
Let’s look at the input parameters of our newly-created function:
timeData: This parameter is expected to be an array of objects that contains atimeproperty that is set to the timestamp of the event that should be counted. The objects should also contain aweightproperty, which is used to count. Using this property, we can count one event as two or even count minus values to decrease the count in a raster.timeFrame: This parameter specifies the time span of each raster in milliseconds. If we want to have 24 rasterized frames, each consisting of one hour this parameter needs to be set to 3,600,000 (1 h = 60 min = 3,600 s = 3,600,000 ms).quantity: This parameter sets the amount of rasterized frames that should be present in the output array. In the case of 24 frames of one hour, this parameter should be set to 24.now: This is when our function is rasterizing time, starting at a given point in time backwards. Thenowparameter sets this point in time.fill: This is how we can specify how we’d like our rasterized output array to be initialized. In the case of our activity counts, we want this to be set to0.
The function that we just created is necessary to create the activity chart. The transformation helps us prepare project activities for the input data of the chart.
It’s time to create our first chart component! Let’s start with a new template created on the lib/projects-dunebook/project-summary/activity-chart/activity-chart.html path:
<div #chartContainer></div>
As we leave all the rendering up to Chartist, this is actually already all that we need. Chartist needs an element as a container to create the chart in. We set a chartContainer local view reference so that we can reference it from our component, and then pass it to Chartist.
Let’s move on with the chart creation, and flesh out the activity chart component by creating the Component class in activity-chart.js in the same directory as the template:
...
import Chartist from 'chartist';
import {rasterize, UNITS} from '../../../utilities/time-utilities';

@Component({
selector: 'ngc-activity-chart',
  ...
})
export class ActivityChart {
@Input() activities;
@ViewChild('chartContainer') chartContainer;

ngOnChanges() {
this.createOrUpdateChart();
  }

ngAfterViewInit() {
this.createOrUpdateChart();
  }
  ...
}
Note
Chartist is available for almost all package managers, and it also comes bundled in the UMD module format (Universal Module Format), which, in fact, is a wrapper to enable AMD (Asynchronous Module Definition), CommonJS module format, and global export.
Using JSPM, we can simply install Chartist by executing the following command on the command line:
jspm install chartist
After installing Chartist, we can directly import it using ES6 module syntax.
We also import the rasterize function that we created so that we can use it later to convert our activities into the expected input format for our chart.
As we rely on a view child as a container element to create our chart, we need to wait for the AfterViewInit lifecycle hook in order to construct the chart. At the same time, we need to rerender the chart if the input activities change. Using the OnChanges lifecycle hook, we can react on input changes and update our chart.
Let’s now look at the createOrUpdateChart function, which does exactly what its name already implies:
createOrUpdateChart() {
if (!this.activities || !this.chartContainer) {
return;
  }

consttimeData = this.activities.map((activity) => {
return {
time: activity.time,
weight: 1
    };
  });

const series = [
rasterize(
timeData,
UNITS.find((unit) => unit.short === 'h').milliseconds,
      24,
      +new Date())
  ];

if (this.chart) {
this.chart.update({ series });
  } else {
this.chart = new Chartist.Bar(this.chartContainer.nativeElement, {
series
    }, {
width: '100%',
height: 60,
axisY: {
onlyInteger: true,
showGrid: false,
showLabel: false,
offset: 0
      },
axisX: {
showGrid: false,
showLabel: false,
offset: 0
      },
chartPadding: 0
    });
  }
}
Let’s look into the code in more detail and walk through it step by step:
- As we get called both from the
AfterViewInitandOnChangeslifecycle, we need to make sure that both thechartContainerandactivitiesinputs are ready before we continue. - Now, it’s time to convert the activity data that we receive as input into the rasterized form that is required for the chart that we’d like to create. We use
Array.prototype.mapto transform our activities into thetimeDataobjects that are required by therasterizefunction. We also pass the necessary parameters so that the function will rasterize into 24 frames, each consisting of one hour. - If the
chartmember is already set to a chart that was previously created, we can use theupdatefunction on the Chartist chart object to only update with the new data. - If there’s no chart object already, we need to create a new chart. As a first parameter to the
Chartist.Barconstructor, we’ll pass the DOM element reference of our container view child. Chartist will create our chart in this container element. The second argument is our data, which we fill with the series that was just generated. In the chart options, we’ll set everything to achieve a very plain-looking chart without any detailed information.
This is great! We created our first chart component using Chartist! Now, we can go back to our ProjectSummary component and integrate the activity chart there to provide an activity overview:
...
import {ActivityService} from '../../activities/activity-service/activity-service';
import {ActivityChart} from './activity-chart/activity-chart';

@Component({
selector: 'ngc-project-summary',
  ...
directives: [EffortsTimeline, ActivityChart],
  ...
})
export class ProjectSummary {
  ...
constructor(@Inject(ActivityService) activityService) {
this.activityService = activityService;
  }

ngOnChanges() {
if (this.project) {
      ...

this.activities = this.activityService.change
        .map((activities) => activities.filter((activity) => activity.subject === this.project._id));
    }
  }
}
The first change here is to include the ActivityService so that we can extract the required project activities to pass them to the ActivityChart component. We also need to import the ActivityChart component and declare it as a directive on the component.
As our component relies on the project to be provided as input, which is subject to change, we need to implement the logic to extract activities in the OnChanges lifecycle hook of the component.
Before we pass on the observable activities stream, we need to filter the activities that come through the stream so that we only get activities that are relevant to the current project. Again, we will use the async pipe in order to subscribe to the activities so that there’s no need to use a subscribe form within the component. The activities property will be directly set to a filtered Observable.
Let’s look at the changes in the view of the ProjectSummary component in order to enable our chart:
...
<div class="project-summary__label">Activity last 24 hours</div>
<ngc-activity-chart [activities]="activities | async">
</ngc-activity-chart>
We add our ActivityChart component at the bottom of the already existing template. We also create the necessary binding to pass our activities into the component. Using the async pipe, we can resolve the observable stream and pass the filtered activities list into the chart component.
Finally, our ProjectSummary Tracker looks great and immediately provides a project insight by displaying the aggregated efforts timeline and a nice activity chart. In the next section, we’ll dive a bit deeper into the charting capabilities of Chartist, and we will also provide some interactivity using Angular.