Learn All About Gantt Charts To Perk Up Your Project Planning

Learn All About Gantt Charts To Perk Up Your Project Planning
Gantt charts are a powerful tool for project management, but many people struggle to understand how to use them effectively.
In this blog, we’ll look at Gantt charts, how they work, and how you can use them to plan and track your projects more efficiently. Whether you’re a seasoned project manager or starting out, you’ll find useful information in this blog to help you master the art of Gantt charts.
What is a Gantt Chart?
To successfully complete a project, you must control many activities and ensure they’re completed on time. Here the Gantt chart comes in handy.
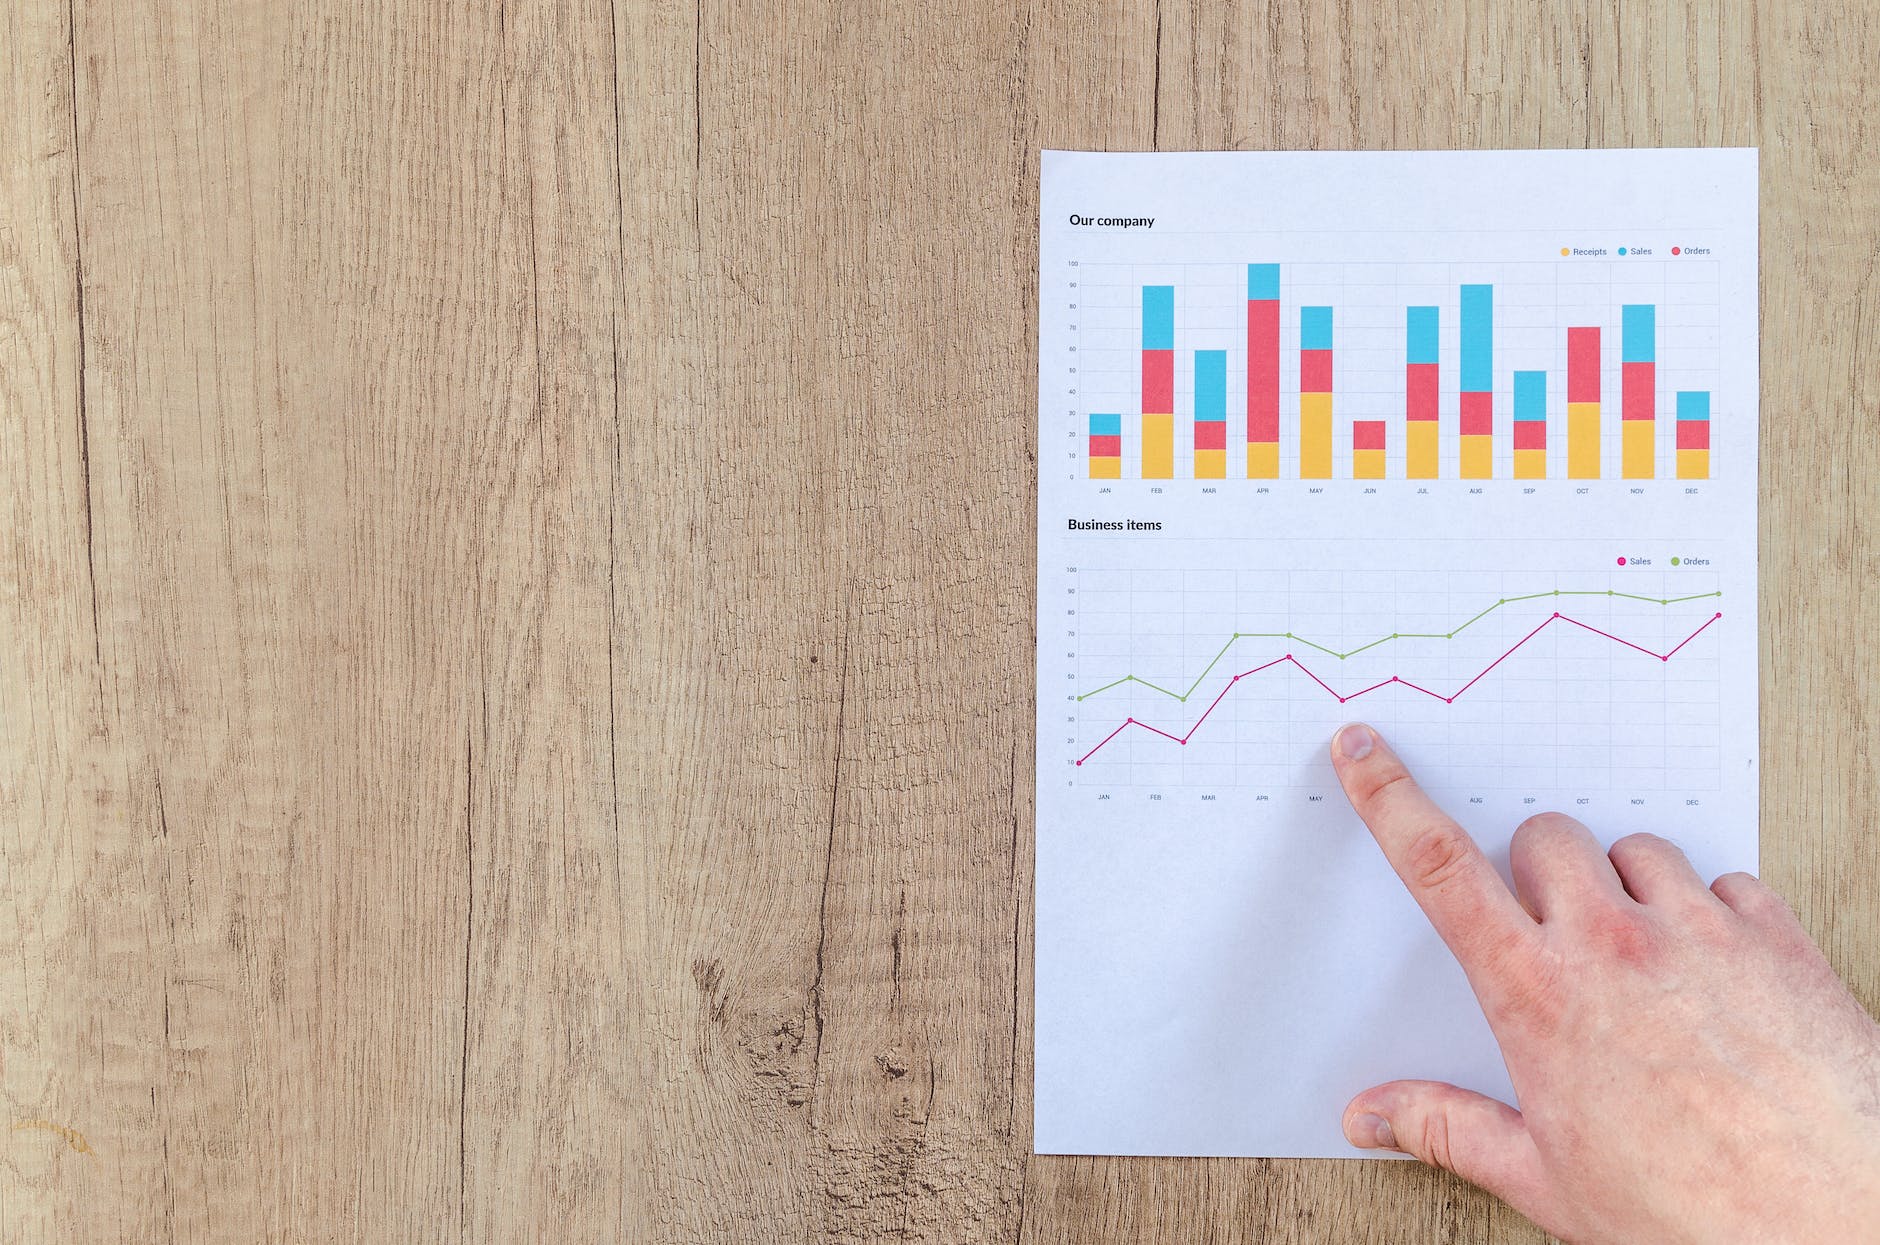
A Gantt chart is a bar chart that visually represents a project plan over time. It is considered one of the most important project management tools. It highlights a particular project’s activities, tasks, or events against a timescale. Not just this, the modern Gantt charts show us the status and the responsible person for each task in the project. They are useful in planning all kinds of projects, regardless of size and industry.
In short, Gantt Charts are useful for showing:
- List of tasks that need to be performed to complete a project.
- When tasks need to be done. (defined timeframe)
Key Components of a Gantt Chart:
- Kickoff and end dates of a project
- Project Milestones
- Resource assignment
- Dependencies
- Task List
- Project schedule and progress
Benefits Of Gantt Charts
Gantt charts are a valuable Project management planning and reporting tool that keeps Project Team on its toes to deliver project milestones successfully and on time.
Here are a few benefits of using Gantt Charts:
They make complex information easy to read and understand
Gantt Charts use visual representation to convey the information related to:
- All the tasks of the project
- Who is responsible for the tasks?
- How long will it take to complete the tasks?
Increase the performances
Gantt charts help the project team members to better manage their time which ultimately contributes to increasing the overall productivity and performance of the project.
Efficient Resource Planning
Gantt charts are helpful in effectively allocating tasks and resources. It helps the project managers visualize the resource capacity, allowing them to optimally allocate the resources without overusing them.
Clear Dependencies
Gantt charts help clearly highlight the project dependencies between tasks that result in the smooth functioning of the project.
How to use Gantt Charts?
Project managers can Gantt charts to showcase various project schedules in their project management presentations.
showing the start and end dates of tasks and their dependencies. To use a Gantt chart:
- Note down your task’s start and end date and their dependencies.
- List the tasks for the successful completion of your project.
- Establish the task dependencies, i.e., which tasks must be completed and given priority before others can start.
- Plot the tasks on the chart as horizontal bars, with the start date on the left and the end date on the right.
- Use arrows to indicate dependencies between tasks.
- Use the chart to monitor progress and adjust the schedule as needed.
How to use Gantt Charts in presentations?
To use Gantt charts in presentations:
- Create the Gantt chart in a project management tool or spreadsheet software.
- Import the chart into your presentation software. You can take the help of graphics for PowerPoint to access various pre-made charts and graphs for your project management needs.
- Showcase the project schedule and task dependencies on your chart.
- Highlight key milestones and important dates.
- Use colors to differentiate tasks and visually organize your key points or information.
- Incorporate the Gantt chart into your overall presentation design and format.
- Use the chart as a reference and visual aid during the presentation.
- Update the chart as the project progresses to keep it accurate and up-to-date.
Conclusion:
Gantt charts are undoubtedly the most essential tool for project management, providing a visual representation of task schedules and dependencies. With its clear and organized format, a Gantt chart can help project managers stay on top of their tasks and deadlines while communicating project progress to stakeholders.
Whether you’re new to project management or an experienced professional, learning how to effectively use Gantt charts will greatly benefit your work. So, start using Gantt charts today and experience the difference they can make in managing and executing successful projects.